
Investment Research Note – April 15, 2019
Review:
Stocks have snapped back swiftly following the brutal close of 2018 as the losses from the worst quarter and month for US Large Cap stocks since the Financial Crisis have almost been entirely recouped. At the end of the 1st quarter 2019, the S&P 500 sat just 2.5% below it’s all time intraday high recorded on September 21, 2018. The S&P 500 posted a +13.65% gain for the 1st quarter 2019 – its best 1st Quarter since 1998. Along with US Large Caps, most other global assets rallied as well. Global stocks ex-US ended the 1st Quarter up +10.45%.1
These past three months have been in such stark contrast to the three months prior that is begs the question: what changed? Unfortunately, there’s no easy answer to that question but we can point to some changing conditions that obviously influenced the risk appetite of investors: The Fed pivoting on monetary policy, economic and corporate profit slowdown (or even recession) fears waning, improving prospects for a US/China trade deal, and cheaper valuations all contributed. In observing how fast the switch can be flipped, the most important takeaway from the last six months is that staying invested is critical during times of market volatility. Very often the best periods of performance for stocks occur in close proximity to the worst periods. Timing the tops and bottoms of the market is nearly impossible to do on a consistent basis. Investors who stick to their strategic long-term plan and remain calm during turbulent times historically see a rebound in stocks eventually.
Equities:
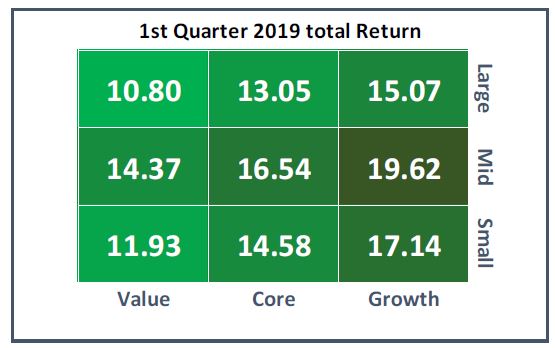
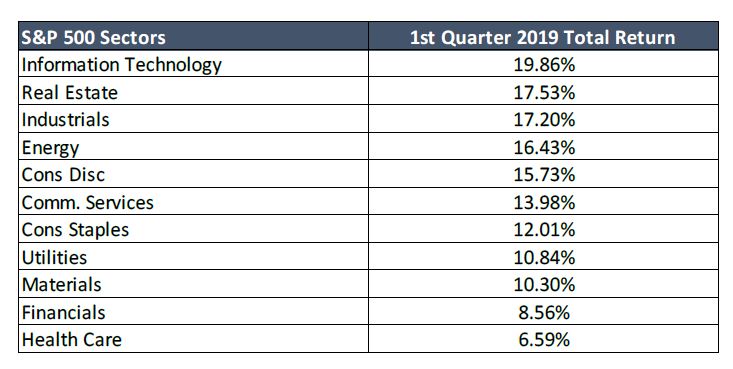
The recent rally has possessed broad participation across the market It’s leadership has not been confined to a select few influential names or a couple sectors. For example, the S&P 500 Equal Weight Index, which assigns the same weight to each constituent, outperformed it’s market cap weighted counterpart, the S&P 500 Index, by 1.26% in the 1st Quarter. Down the market cap line, US Mid and Small Cap stocks also outperformed with the Russell Mid Cap Index up +16.54% and the Russell 2000 Index up +14.58% during the quarter. Style wise, Growth outperformed Value, the Russell 3000 Growth Index returned +16.18% vs. +11.93% for the Russell 3000 Value Index. This discrepancy was partially due to Financials (a significant Value sector) lagging as rates fell and the yield curve flattened. The leading sector was Information Technology followed by Real Estate, which, as opposed to Financials, tends to benefit from falling bond yields. Energy stocks rallied as the price of Crude Oil shot up after a poor 2018.2
Globally, stocks in developed and emerging markets rallied as well, although less than US equities. Emerging Markets, a notably weak performer during most of 2018, had begun to outperform in the 4th quarter, losing only -7.46%. So far this year, the MSCI Emerging Markets Index is up +9.91%, led by a resurgent Chinese market, which was up +17.56% during the 1st quarter of this year. Developed International markets finished positive, +9.98%. Europe and the UK continues to grapple with Brexit almost 3 years after the initial referendum.3
Fixed Income:
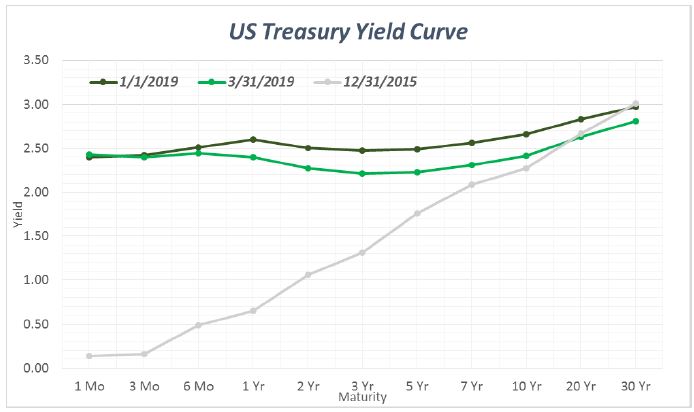
The Bloomberg Barclays US Aggregate Index had a strong quarter as well – posting a +2.94% return, the best quarterly return for the broad fixed income index since the 1st quarter of 2016.4 The benchmark 10-year treasury yield fell throughout the quarter, moving from 2.66% on January 2nd to a low for the year of 2.39% on March 28th, the lowest yield on the 10-year since the end of 2017. The topic of the yield curve inverting and the signals from that shape ramped up, most notably when the 3-month Treasury yield exceeded the 10-year Treasury yield. Although, that measure has historically not been a noteworthy spread to track. The more common spreads have still not inverted. The 30-year to 2-year spread actually steepened during the quarter and 10-year to 2-year flattened by only 2 basis points.5 The topic will continue to be discussed as an inversion is seen as a reliable forecaster of recessions. However, on average, it takes 14 months from inversion to recession. Additionally, it should be under consideration that today’s monetary policies are unprecedented and bond yields may not be the same indicator they have been historically.6
Credit responded along with equities during the quarter, the Bloomberg Barclays High Yield Index ended up +7.26%, Investment Grade issues were up +6.24% and the Credit Suisse Bank Loans ended up +3.78%. This was another example of investors flowing back into riskier assets during the quarter. Municipal issues also did well, with the Bloomberg Barclays Municipal Index up +2.90% for the quarter.7
Outlook:
A contributing factor to the volatility at the end of last year was worrisome commentary from certain corporations regarding their profitability in 2019 and beyond. According to FactSet, estimates are now calling for a -4.2% decline in year-over-year earnings for the 1st Quarter of 2019 – this estimate has been gradually lowered over the past few months (as of 12/31/18 it was at +2.8% growth). So, the market theoretically has priced in these weak earnings, and any positive surprise could be greeted favorably by investors. If earnings are even flat this quarter and can generate growth for the entire year, that could be an additional spark for stocks. Furthermore, top line revenue growth is forecast to be +4.7% for the quarter.8
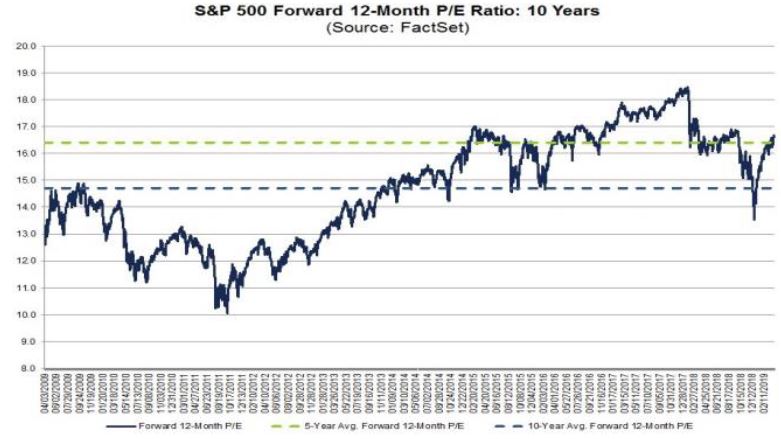
As stocks have rebounded so have valuations. The forward P/E ratio sits at 16.7x for the S&P 500, which is right around its recent average. It had dipped significantly below that average as stocks fell at the end of last year.9
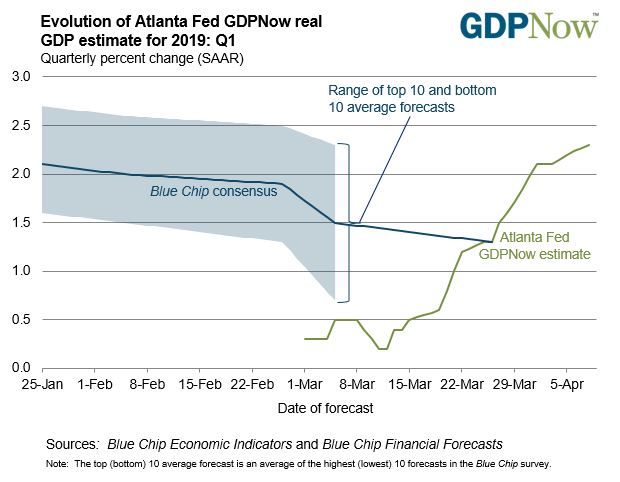
The economic outlook has improved throughout this quarter. Growth doesn’t appear to be as strong as the stimulus driven growth of 2018 but fears of an imminent recession have significantly waned. As data has come in, the Atlanta Fed’s GDPNow forecast for the 1st Quarter has improved from a frightfully low initial forecast of +0.3% to a robust +2.3% as of April 8th.10 This lends increasing optimism to economic growth given the consistently underwhelming 1st quarter prints in GDP we have seen over the past several years. +2.3% would be the strongest 1st quarter of a calendar year since 2015.11 In addition, the labor market continues to strong. Nonfarm payrolls outpaced estimates and added 196,000 jobs in the March reading, with the unemployment rate holding steady at 3.8%. This was a closely watched reading coming off February’s low print of just 20,000 jobs. Wage gains seem to be leveling off from their recent strong pace, increasing at a 3.2% current pace year-over-year, displacing some remaining slack in the labor market.12
These data points all go to show that the current “goldilocks” conditions of: an easy Fed, low/moderate economic growth, low inflation and stable corporate profits is looking like the status quo for the time being. Although it could happen, the actual data is not convincingly warning investors that a recession is imminent regardless of what the yield curve looks like or how “long in the tooth” the expansion has become (it’s been going on for 117 months now)13.
– John Nagle, CFA
The views expressed herein are those of John Nagle on April 15th, 2019 and are subject to change at any time based on market or other conditions, as are statements of financial market trends, which are based on current market conditions. This information is provided as a service to clients and friends of Kavar Capital Partners, LLC solely for their own use and information. The information provided is for general informational purposes only and should not be considered an individualized recommendation of any particular security, strategy or investment product, and should not be construed as, investment, legal or tax advice. Past performance does not ensure future results. Kavar Capital Partners, LLC makes no warranties with regard to the information or results obtained by its use and disclaims any liability arising out of your use of, or reliance on, the information. The information is subject to change and, although based on information that Kavar Capital Partners, LLC considers reliable, it is not guaranteed as to accuracy or completeness. This information may become outdated and we are not obligated to update any information or opinions contained herein. Articles may not necessarily reflect the investment position or the strategies of our firm.
This market commentary is a publication of Kavar Capital Partners, LLC. It should not be regarded as a complete analysis of the subjects discussed. All expressions of opinion reflect the judgment of the author on the date of publication and are subject to change. Content should not be viewed as personalized investment advice or as an offer to buy or sell, or a solicitation of any offer to buy or sell the securities mentioned herein. Different types of investments involve varying degrees of risk, and there can be no assurance that any specific investment or strategy will be suitable or profitable for a client’s investment portfolio. All investment strategies have the potential for profit or loss. Asset allocation and diversification do not ensure or guarantee better performance and cannot eliminate the risk of investment losses. Asset allocation and diversification do not ensure or guarantee better performance and cannot eliminate the risk of investment losses. Charts and graphs do not represent the performance of Kavar Capital Partners, LLC or any of its advisory clients. Historical performance results for investment indexes and/or categories, generally do not reflect the deduction of transaction and/or custodial charges or the deduction of an investment management fee, the incurrence of which would have the effect of decreasing historical performance results. There can be no assurances that a client’s portfolio will match or outperform any particular benchmark. Projections and opinions are based on assumptions that may not come to pass. Data is derived from sources deemed to be reliable. Kavar Capital Partners, LLC is registered as an investment adviser and only transacts business in states where it is properly registered, or is excluded or exempted from registration requirements. Registration as an investment adviser does not constitute an endorsement of the firm by securities regulators nor does it indicate that the adviser has attained a particular level of skill or ability.
Footnotes:
Footnotes:
- Morningstar Direct Data
- Morningstar Direct Data
- Morningstar Direct Data
- Morningstar Direct Data
- US Treasury (https://www.treasury.gov/resource-center/data-chart-center/interest-rates/Pages/TextView.aspx?data=yield)
- JPMorgan Guide to the Markets (https://am.jpmorgan.com/blob-gim/1383407651970/83456/MI-GTM_2Q19_2.pdf?segment=AMERICAS_US_ADV&locale=en_US)
- Morningstar Direct Data
- FactSet Earnings Insight (https://www.factset.com/hubfs/Resources%20Section/Research%20Desk/Earnings%20Insight/EarningsInsight_041219.pdf)
- FactSet Earnings Insight (https://www.factset.com/hubfs/Resources%20Section/Research%20Desk/Earnings%20Insight/EarningsInsight_041219.pdf)
- Atlanta Fed (https://www.frbatlanta.org/cqer/research/gdpnow.aspx)
- Louis Fed (https://fred.stlouisfed.org/series/GDP)
- Louis Fed (https://fred.stlouisfed.org/series/PAYEMS, https://fred.stlouisfed.org/series/UNRATE, https://fred.stlouisfed.org/series/CES0500000003)
- JPMorgan Guide to the Markets (https://am.jpmorgan.com/blob-gim/1383407651970/83456/MI-GTM_2Q19_2.pdf?segment=AMERICAS_US_ADV&locale=en_US)