Investment Research Note – July 7th, 2021
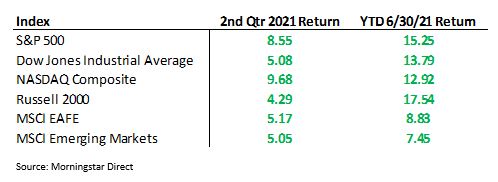
At the halfway point of 2021 markets continue to push upwards as the re-opening economy booms. The S&P 500 was up +8.55% for the 2nd quarter, eclipsing the +6.17% for the 1st quarter of the year and bringing the year-to-date return to +15.25% through 6/30/21. This is the second best first half performance for the benchmark since 1998 (behind only 2019’s +17% first half gain). The Dow Jones Industrial Average finished the quarter up +5.08%, now up +13.79% for the year. The NASDAQ Composite posted better performance after a mild 1st quarter, up +9.68% for the 2nd quarter.1

Bonds broadly returned a positive quarter with the Bloomberg Barclays US Aggregate Bond Index up +1.83%2 for the quarter as the 10-year Treasury rate fell from 1.74% to 1.45% during the three months ending 6/30/21.3 The Bloomberg Barclays US Aggregate Bond Index remains down for the year at -1.60% through 6/30/21.4
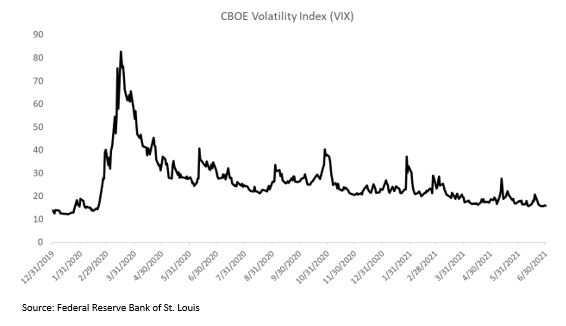
In spite of the craziness on the market peripheries, cryptocurrencies and meme stocks for example, a calmness has set in over the core of markets as volatility has subsided since the historical peak registered in March of 2020 at the height of market panic surrounding the pandemic. The CBOE Volatility Index (VIX) ended the quarter at 15.83, returning it to pre-pandemic levels.5

Reinforcing the steadiness of markets so far this year, the S&P 500 and Dow Jones Industrial Average have experienced pullbacks of only -4.13% and -4.16% respectively on a closing basis during the year, while the NASDAQ drew down -10.49% during the rotation out of Technology stocks earlier in the year. The bellwether S&P 500 has not had a correction of -5% or worse since September 2020.6
The calmness is a welcome change of pace for investors after 2020 but should not invite a sense of complacency as investing challenges and risks are undeniable as markets move forward. While 2020 was an ideal environment to evaluate an investors’ process and principles due to the volatility, 2021 is an environment to re-visit risk tolerance and asset allocation in anticipation of the next period of elevated volatility.
Market Breakdown

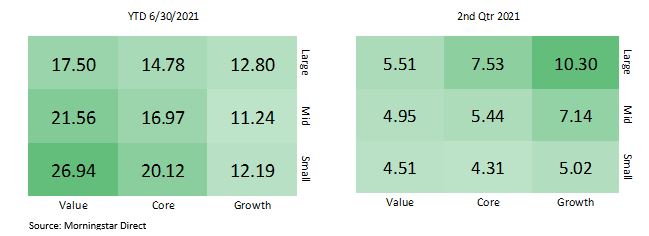
The two trends driving equity returns during 2021 – broadening out (Small and Mid-cap companies outperforming Large-cap companies) and rotation (from Growth to Value) – hit some resistance during the 2nd quarter as Large-caps outpaced Small and Mid-caps and Growth stocks were back in favor.
These rotations seemingly hinge in part on the direction of interest rates and the outlook for inflation. Rising rates and inflation expectations have been seen as a headwind to Growth stocks.
Inflation expectations peaked for the year right around May 12th, 2021 with the release of the monthly Consumer Price Index (CPI), a closely followed gauge of consumer prices. The increase in the annual headline CPI rate was the fastest since September 2008 and the largest monthly gain in core inflation since 1981.7 These hot prints intensified the debate over the two general mindsets regarding inflation:
A. Are current inflation readings “transitory”, meaning short-term increases due to supply chain disruptions, pent-up demand, and low base effects given the year-over-year comparisons going back to the pandemic induced economic shutdowns?
Or, B. Are the readings a harbinger of a new, higher, inflation regime, caused by a drastic increase in the money supply and overly accommodative monetary policy?
The ultimate outcome of the inflation debate will take years to crystalize. In the meantime the investment implications are dynamic as the market interprets ongoing inflation data and importantly interprets the comments and projections of the Federal Reserve regarding inflation and it’s impact on monetary policy.
For the year, Small-cap and Value stocks outperformance remains given the strong 1st quarter for these factors. Further demonstrating the market’s breadth, the S&P 500 Equal Weight Index, +19.18% for the six months ending 6/30/21, has outperformed the traditional market-cap weighted S&P 500.8
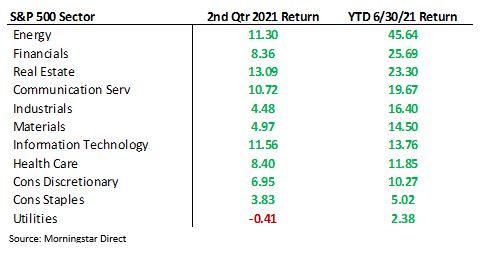
Energy, Financial and Real Estate continue to lead the way in 2021 from a sector perspective, performing as expected given the rise in commodity prices, interest rates and inflation expectations during the year. During the 2nd quarter, Technology stocks rebounded after a relatively weak 1st quarter.9
Utilities and Consumer Staples are the sector laggards thus far for the year10.

Globally, the rotation out of US and into International stocks has failed to materialize over any significant stretch this year. MSCI EAFE, +8.83% for the year, and MSCI Emerging Markets, +7.45%, are positive but continue to lag US issues.11
Valuations and Earnings
As the virus situation improved and economic growth expectations rose, so too have corporate earnings in a big way. The S&P 500 is on pace to record earnings growth of +35.5% for all of 2021, as well as revenue growth of +12.4%. 2nd quarter 2021 results will begin to be released this month and are forecasted to grow +63.6% compared to the 2nd quarter 2020, which would be the largest year-over-year increase since 2009.12
Of course, this is partially due to the comparison of a re-opening economy (2nd quarter 2021) vs. a locked down one (2nd quarter 2020) but the level of earnings today has surpassed pre-COVID levels, signaling the tremendous health of corporations as the crisis abates.13
The forward price-to-earnings (P/E) ratio sits at 21.4x for the S&P 500 as of 7/2/21, above the 5-year (18.1x) and 10-year (16.1x). During the 2nd quarter, the ratio compressed marginally, as the 12-month forward EPS estimate increased by +10.8 vs. the price increase of +8.7% for the index.14
The views expressed herein are those of John Nagle on July 7th, 2021 and are subject to change at any time based on market or other conditions, as are statements of financial market trends, which are based on current market conditions. This market commentary is a publication of Kavar Capital Partners (KCP) and is provided as a service to clients and friends of KCP solely for their own use and information. The information provided is for general informational purposes only and should not be considered an individualized recommendation of any particular security, strategy or investment product, and should not be construed as, investment, legal or tax advice. Different types of investments involve varying degrees of risk, and there can be no assurance that any specific investment or strategy will be suitable or profitable for a client’s investment portfolio. All investment strategies have the potential for profit or loss and past performance does not ensure future results. Asset allocation and diversification do not ensure or guarantee better performance and cannot eliminate the risk of investment losses. Charts and graphs presented do not represent the performance of KCP or any of its advisory clients. Historical performance results for investment indexes and/or categories, generally do not reflect the deduction of transaction and/or custodial charges or the deduction of an investment management fee, the incurrence of which would have the effect of decreasing historical performance results. There can be no assurances that a client’s portfolio will match or outperform any particular benchmark. KCP makes no warranties with regard to the information or results obtained by its use and disclaims any liability arising out of your use of, or reliance on, the information. The information is subject to change and, although based on information that KCP considers reliable, it is not guaranteed as to accuracy or completeness. This information may become outdated and KCP is not obligated to update any information or opinions contained herein. Articles herein may not necessarily reflect the investment position or the strategies of KCP. KCP is registered as an investment adviser and only transacts business in states where it is properly registered or is excluded or exempted from registration requirements. Registration as an investment adviser does not constitute an endorsement of the firm by securities regulators nor does it indicate that the adviser has attained a particular level of skill or ability.
Footnotes:
- Morningstar Direct Data
- Morningstar Direct Data
- US Treasury
https://www.treasury.gov/resource-center/data-chart-center/interest-rates/Pages/TextView.aspx?data=yieldYear&year=2021 - Morningstar Direct Data
- FRED, Federal Reserve Bank of St. Louis
https://fred.stlouisfed.org/series/VIXCLS - Morningstar Direct Data
- CNBC “Inflation speeds up in April as consumer prices leap 4.2%, fastest since 2008” https://www.cnbc.com/2021/05/12/consumer-price-index-april-2021.html
- Morningstar Direct Data
- Morningstar Direct Data
- Morningstar Direct Data
- Morningstar Direct Data
- FactSet Earnings Insight https://www.factset.com/hubfs/Website/Resources%20Section/Research%20Desk/Earnings%20Insight/EarningsInsight_070221.pdf?
- FactSet Earnings Insight https://www.factset.com/hubfs/Website/Resources%20Section/Research%20Desk/Earnings%20Insight/EarningsInsight_070221.pdf?
- FactSet Earnings Insight
https://www.factset.com/hubfs/Website/Resources%20Section/Research%20Desk/Earnings%20Insight/EarningsInsight_070221.pdf?
