
Market Update – November 18th, 2026
Over the past week, US stocks have come under renewed pressure as two of investors’ biggest concerns this fall have collided: persistent inflation that is forcing the Federal Reserve to raise interest rates and a crisis of confidence in the Artificial Intelligence (AI) trade that has led markets higher for the better part of three years.
The S&P 500 has fallen in five straight sessions and closed today at 7,323.63, its lowest close since July 29th and -6.33% below its all-time closing high of 7,818.93 made on October 6th. The Tech-heavy NASDAQ Composite has fared worse, down -11.49% from its high and firmly in correction territory. The selling was initially focused in Technology but broadened this week. On Tuesday, all 11 S&P 500 sectors finished lower and 426 of the 500 stocks in the index declined. The Dow Jones Industrial Average has fallen more than -1% each day this week.1
The table below shows where each of the major US indexes stands relative to its all-time closing high:

Despite the pullback, the S&P 500 remains up +8.05% for the year, and global equity portfolios have largely been positive in 2026, though not without bouts of volatility.2
Within this update, we want to frame why diversified portfolios are holding up better than the headlines suggest, the key drivers of the recent weakness and what we are most closely monitoring from here.
Diversification Is Working
While the headline indexes, and particularly the large-cap growth cohort, capture the attention, a diversified portfolio is holding up considerably better as you broaden out exposure. Through today, the Russell 1000 Value Index was up +3.24% in the 4th quarter and +23.13% for the year, while the Russell 1000 Growth Index was down -11.50% and -5.92% over the same periods.3
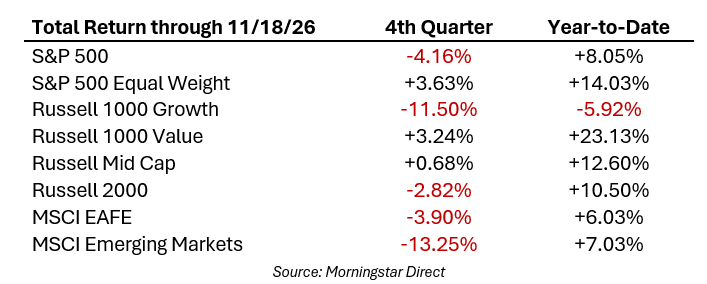
The average stock is also outpacing the index. The S&P 500 Equal Weight Index is up +3.63% in the 4th quarter and +14.03% for the year, compared to -4.16% and +8.05% for the market-cap weighted S&P 500. In October, the gap between the two was the widest in favor of the average stock since April 2009. Mid-cap and Small-cap stocks are also ahead of the S&P 500 for the year, with the Russell Mid Cap Index up +12.60% and the Russell 2000 up +10.50%. International stocks remain positive for the year, with the MSCI EAFE Index up +6.03% and the MSCI Emerging Markets Index up +7.03%.4
The 4th quarter has reinforced the principle and importance of maintaining exposure across investment styles, sectors, market capitalizations, and geographies rather than attempting to anticipate each change in market leadership.
No area has really been immune this week, as Tuesday’s broad decline showed, and Emerging Markets have given back considerable ground in the 4th quarter. But this is the benefit of diversifying from the concentration at the top of the index: the areas of the market that lagged in recent history are providing balance.
Inflation and the Fed
The October Consumer Price Index (CPI) report came in hotter than expected last week, with headline prices rising +0.4% for the month and Core CPI rising +0.3%, each 0.1% above estimates.5 The Fed raised rates in September for the first time since 2023, bringing the Fed Funds Rate target range to 3.75%-4.00%, and the market now views another hike at the December 8th-9th meeting as a near certainty.6 Today, Fed Governor Christopher Waller stated that a 0.50% hike should be considered, and St. Louis Fed President Alberto Musalem suggested this week that as many as four more hikes may be needed by spring.7,8 So the discussion has shifted from “will the Fed hike?” to “how much will the Fed hike?”
The 10-year US Treasury yield closed today at 5.068%, below the 5.29% where it ended the 3rd quarter but still at a level that raises the cost of capital across the economy and offers investors a real alternative to stocks.9
The AI Trade and Nvidia
Investor enthusiasm for AI had begun to fade well before the past week. The NASDAQ peaked on October 6th and had fallen -7.8% from that high by the end of October, as 3rd quarter earnings from the largest technology companies intensified questions about whether the returns on AI spending can justify the scale of the investment, particularly with borrowing costs rising.10
The November 3rd midterm elections then added a layer of policy uncertainty. Democrats won control of both chambers of Congress, candidates who campaigned on restricting data center construction won the governor’s races in Texas, Ohio and Georgia, and voters sided against data centers in the vast majority of local ballot measures.11 AI infrastructure stocks sold off sharply in the days that followed. In our view, the practical impact is likely to be more gradual than the market’s initial reaction implied, as the new Congress is not seated until January, any federal legislation would require the President’s signature and much of the data center capacity planned for 2027 is already under construction. But it was another headwind for a narrative that had been priced for few obstacles.
And finally, against that backdrop, Nvidia, the largest beneficiary of the AI buildout and until recently the largest stock in the world, has been the focal point of the selling over the past week. The scandal and abrupt resignation of CEO Jensen Huang on November 12th came as a shock to investors, and it raised new questions about the company’s direction at an already uncertain time. Even so, the business itself continues to deliver. After the close on Tuesday, Nvidia reported revenue and earnings surpassing estimates and raised guidance on future revenues, but the stock fell anyway.12 In our view, that tells us investors are less concerned with current results and more concerned with whether AI spending can be sustained into 2027, particularly as more of it is being financed with debt, and what the post-Jensen era means for the company and the industry.
Adding to the news cycle, the Anthropic IPO, set to price tonight and begin trading Thursday, will be another important read on investor appetite for AI.
Rising Volatility
Volatility has picked up alongside the downturn. The CBOE Volatility Index (VIX), which measures the market’s expectation of volatility, rose in four straight sessions, from 17.49 last Wednesday to 25.46 at Tuesday’s close, and touched 27.73 intraday. For context, the long-run average for the VIX is roughly 19 and this year’s closing high was 31.05 on March 27th during the Iran conflict.13 The current reading reflects above-average uncertainty, but it remains below the levels reached in March and earlier this month.
Going Forward
Market pullbacks, like the current one, are a normal part of investing. This is the third decline of -5% or more for the S&P 500 this year, and the first two gave way to new highs.14 Importantly, the fundamental backdrop remains intact, in our view. S&P 500 earnings remain on pace to grow more than +30% this year and are forecasted to grow another +15% in 2027.15
As the market works through its two primary concerns among others, here are some dynamics we’ll be monitoring closely:
- The Fed’s December 9th decision: a 0.25% hike is widely expected and largely reflected in markets. More clarity on the path for rates in 2027 would be welcome.
- Inflation and energy prices: any sign that inflation is resuming its path lower would likely ease the pressure on interest rates.
- AI spending: Nvidia’s results this week showed that current demand remains strong, but capital spending plans from the largest technology companies will continue to be scrutinized.
- Market breadth: leadership is broadening, which is a healthy development for the market, in our view.
Periods like this can feel unsettling, but they are also when diversification proves its value. Balanced portfolios are holding up well; high-quality bonds are offering more opportunity than they have in two decades, and pullbacks create opportunities to add quality investments at better prices. We remain focused on the long term and are always looking for opportunities from market dislocation.
As always, if you have any questions or concerns, please do not hesitate to reach out to our team.
Footnotes:
- Morningstar Direct
- Morningstar Direct
- Morningstar Direct
- Morningstar Direct
- St. Louis Federal Reserve FRED
- CME Group FedWatch
- CNBC https://www.cnbc.com/2026/11/18/federal-reserve-governor-christopher-waller.html
- CNBC https://www.cnbc.com/2026/11/17/alberto-musalem-fed-interest-rates.html
- US Treasury
- Morningstar Direct
- CNBC https://www.cnbc.com/2026/11/04/data-center-ballot-measures-2026-midterm.html
- CNBC https://www.cnbc.com/2026/11/18/nvidia-stock-earnings.html
- Morningstar Direct
- Morningstar Direct
- Yardeni Research
The views expressed herein are those of John Nagle on November 18th, 2026, and are subject to change at any time based on market or other conditions, as are statements of financial market trends, which are based on current market conditions. This market commentary is a publication of Kavar Capital Partners (KCP) and is provided as a service to clients and friends of KCP solely for their own use and information. The information provided is for general informational purposes only and should not be considered an individual recommendation of any particular security, strategy or investment product, and should not be construed as investment, legal or tax advice. Different types of investments involve varying degrees of risk, and there can be no assurance that any specific investment or strategy will be suitable or profitable for a client’s investment portfolio. All investment strategies have the potential for profit or loss and past performance does not ensure future results. Asset allocation and diversification do not ensure or guarantee better performance and cannot eliminate the risk of investment losses. The charts and graphs presented do not represent the performance of KCP or any of its advisory clients. Historical performance results for investment indexes and/or categories, generally do not reflect the deduction of transaction and/or custodial charges or the deduction of an investment management fee, the incurrence of which would have the effect of decreasing historical performance results. There can be no assurances that a client’s portfolio will match or outperform any particular benchmark. KCP makes no warranties with regard to the information or results obtained by its use and disclaims any liability arising out of your use of, or reliance on, the information. The information is subject to change and, although based on information that KCP considers reliable, it is not guaranteed as to accuracy or completeness. This information may become outdated and KCP is not obligated to update any information or opinions contained herein. Articles herein may not necessarily reflect the investment position or the strategies of KCP. KCP is registered as an investment adviser and only transacts business in states where it is properly registered or is excluded or exempted from registration requirements. Registration as an investment adviser does not constitute an endorsement of the firm by securities regulators nor does it indicate that the adviser has attained a particular level of skill or ability.