
2025 Investment Outlook – January 31st, 2025
Market Outlook Summary
- The S&P 500 has led markets in back-to-back impressive years for equities, posting 25%+ returns in both 2023 and 2024; however, concerns around valuations and concentration loom over the index. The bar to underweight US Large-Caps as the core component of global equities portfolios is extremely high but our team is emphasizing the importance of rebalancing and diversification in portfolios early on in 2025.1
- The S&P 500 currently trades at a 22x forward P/E, by most measures in the top decile of historically expensive valuations. The top 10 companies in the index make up nearly 40% of the total weight, leaving investors increasingly exposed to the outcomes of those few large companies. Earnings growth is also expected to be robust, with consensus estimates of 15% earnings growth in 2025 and 12% in 2026. The result of a premium valuation on already lofty earnings expectations is a market that is best described as “fully valued.”2
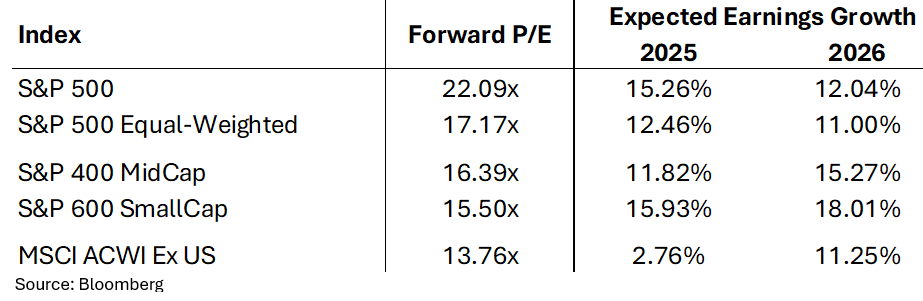
- Outside of the top holdings in the S&P 500, valuations are more palatable, if not attractive. The other 490 stocks in the S&P 500 trade at a P/E of 18.9x. The S&P Small Cap 600 and S&P Mid Cap 400 Indices trade at 15.5x and 16.4x P/E’s respectively. International stocks trade at just 11x and the valuation gap between these stocks and their US counterparts is again at all-time highs.3
- The bond market begins 2025 at an attractive point with positive real (after adjusting for expected inflation) yields across the curve. At these yield levels, we believe fixed income offers a compelling total return opportunity and can serve as an income driver as well as an effective equity market risk diversifier.
- Most credit-sensitive sectors of the bond market continue to trade at historically tight levels, exposing these issues to the significant risk of widening spreads. However, a growing economy and solid corporate credit fundamentals support responsible allocations to these sectors for the incremental yield pickup.
- The economy is expected to growth above trend, with nominal growth in the mid-single digits and real growth of over 2% for the year. The normal mosaic of risks for economic forecasting is present and a higher interest rate environment will continue to strain rate-sensitive areas of the economy, notably in the residential and commercial real estate sectors.4
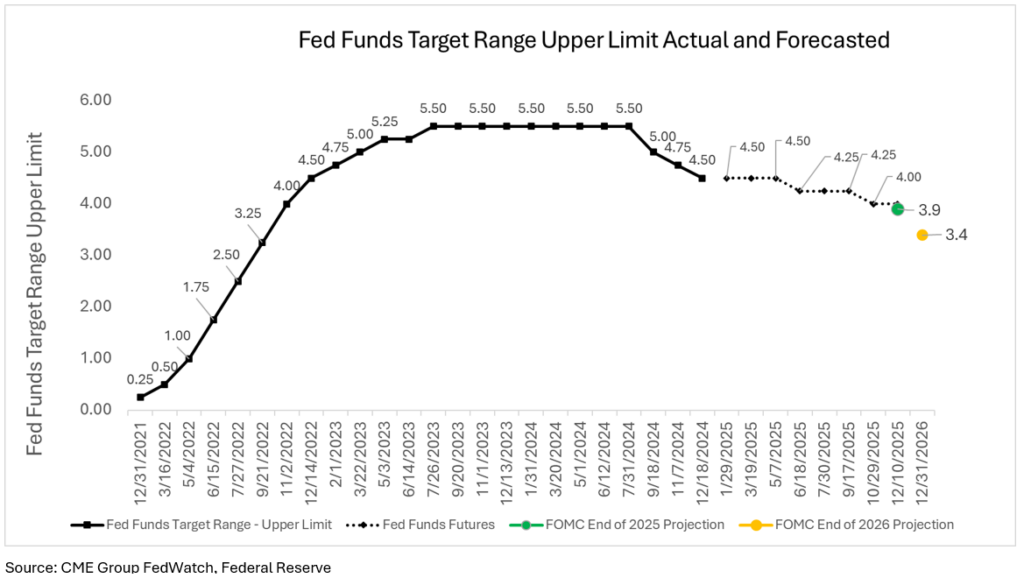
- The Federal Reserve is in a holding pattern as it processes labor and inflation data in the coming months. Inflation remains above its 2% target and the labor market’s resiliency does not point to an immediate need to ease policy. The FOMC forecasted only 2 rate cuts during 2025 at its December 2024 meeting; the bond market is aligned with the Fed, also pricing in 2 rate cuts for the year.5,6
Last year, we encouraged investors to avoid a risk-off approach despite the strong market performance in 2023, as the outlook supported another positive year in 2024. While the S&P 500 surpassed even our optimistic expectations, many areas of global markets delivered only modest returns.
As we move into 2025, we maintain a constructive long-term view on equities, but expect heightened volatility and market drawdowns this year. Our focus remains on building durable, resilient, and diversified portfolios, with equities as the core growth driver over the long term, though forward return expectations are more tempered compared to recent years. Fixed income is poised to reclaim its role as a reliable portfolio diversifier, with higher starting yields offering improved return potential relative to recent history.
This piece is not so much intended to be a forecast for the next 12 months but an outlook on what to watch for and expect as investors. We’ll avoid making precise predictions about markets but will give some rough guidelines of what we think investors should expect from stocks and bonds over the short-term even as we continue to frame investment decision-making with a long-term time horizon in mind.
Equity Outlook
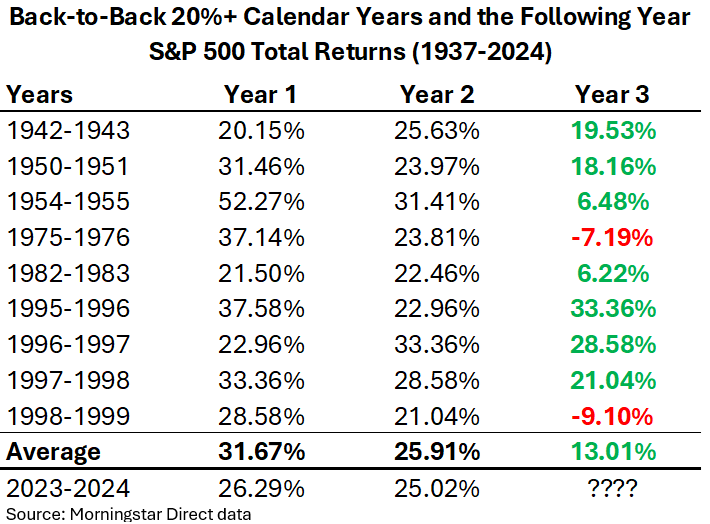
The perspective of recent history is a helpful starting point in our market outlooks and a logical conclusion after the past two years of above average equity market returns is a cautious outlook in the following year. However, looking at the historical data in context, we find that good years tend to cluster together, and the momentum of consecutive big years tends to carry over. Past performance is no guarantee of future results, but on average, the market returns +13% in years following back-to-back 20%+ years and is positive in 7 out of the 9 instances going back to 1937. So, while there are risks to the market today, the past two years’ performance is not at the top of the list.7
Investors should enter each year anticipating two features of markets, both of which were largely absent in 2024: volatility and drawdowns. The S&P 500’s largest drop from high to low was just -8% during 20248 and the CBOE Volatility Index (VIX) averaged 15.55 during the year, below its 19.58 average closing level since 1990.9 Historically, intra-year declines average -14.1% during any given calendar year so investors should be prepared to weather these interruptions regardless of the underlying catalyst(s)10. It is always prudent to re-acclimate with the risks of markets at the beginning of each year.
With last year behind us, we again clear the slate of past performance and look to 2025 and beyond with a fundamental lens, in which the outlook continues to support the “soft landing” scenario. The “soft landing” includes economic growth, inflation, and labor markets moderating along with an accommodative Fed, avoiding a major slowdown in economic activity or labor market distress. These macro factors combined with stellar corporate profitability form an attractive environment for equity investing … but this is mostly priced into markets and the high starting point of equities makes 2025 a challenging set-up for allocators.
Our base case includes:
- Moderate economic growth supported by strong consumer, capital investment and increased productivity.
- Neutral monetary policy with a cautious outlook on future easing.
- Broad-based and strong corporate earnings growth in 2025 and 2026.
- Renewed activity in equity capital markets (M&A and IPOs).
- Intermittent volatility surrounding trade policy, which may impact currency exchange rates.
- Range bound but volatile interest rates.
- Low and stable inflation.
- Tight corporate credit spreads.
As there are levels of uncertainty surrounding those conditions, we have a heightened awareness of the risks to this constructive outlook where a worse-than-expected scenario includes:
- Economic growth disappoints as the pressure from higher rates eventually causes a material slowdown in consumer spending.
- Earnings results and future guidance disappoint – particularly in the Technology sector. Anything except surpassing already lofty expectations is likely to be met with taking profits and selling in some of the major winners in the past 2 years. This disproportionately affects US Large-Cap stocks.
- Inflation re-accelerates or plateaus meaningfully above the Fed’s 2% target and causes the Fed to pivot back to hawkish policy. Trade policy involving tariffs and de-globalization is a clear potential catalyst for this risk.
- Continued pressure on funding the Federal deficit causes interest rate uncertainty and volatility.
- A credit event due to the higher interest rate environment.
- And the potential for some “black swan” event that very few see coming (this is always present). This includes current geopolitical conflicts resurging or a new one emerging.
Acknowledging these risks, our long-run view on equities is that a cyclical bull market began in 2024 when markets broke out above the early 2022 highs and fully recovered from 2022’s cyclical bear market. This bull market was sparked by the relief of lower inflation, which subsequently allowed the Fed to stop tightening monetary policy and usher in a period of economic normalcy post-COVID. Additionally, the extreme capital investment that is being made in Artificial Intelligence (AI) and its current and anticipated impact on productivity and corporate profits is a powerful tailwind to multiple industries, but particularly Technology stocks, the largest sector in the US market.
As we look ahead to 2025 in isolation, it’s worth emphasizing that in investing, “better” or “worse” often carries more significance than “good” or “bad.” In 2023 and 2024, the market benefited from economic growth and earnings growth that consistently exceeded expectations. However, in 2025, the potential for positive surprises may be more limited, as high expectations are already reflected in market valuations and the broader consensus has become more aligned with our constructive view. This makes it more difficult for the economy and markets to deliver unexpected upside.
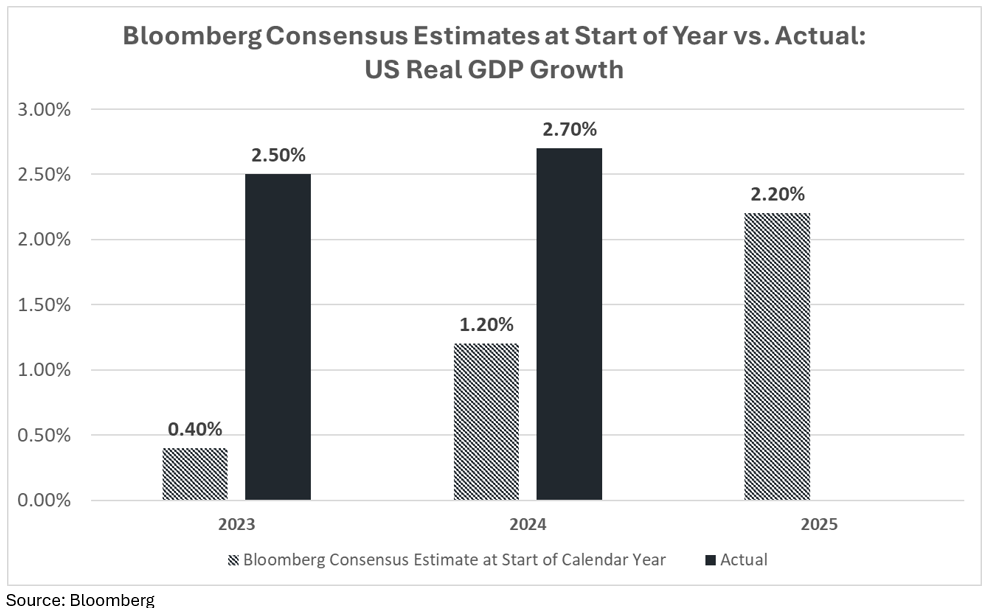
IIn 2025, economic growth is expected to be ‘above trend’—the Fed is now moving toward neutral, and the economy turned out to be less rate-sensitive than initially feared.11 This, along with productivity gains, and anticipated deregulation, pro-business, and growth-friendly policies of a new administration has pushed expectations to real GDP growth of +2.2% in 202512. This is a great sign for continued market strength, but this also means there is little room for the economy to outperform expectations to the degree that it did in 2023 and 2024.
In 2025, earnings are expected to grow to roughly $275 per share for the S&P 500 and in 2026 to $308 per share, growth rates of 15% and 12% respectively.13 These are led by profit gains in the Technology sector, but earnings growth is expected to be widespread across sectors, sizes, and styles of the US market in the next two years—a welcome sign for market breadth. Earnings growth is the most important input for markets as stock returns track their growth over the long-term but these elevated expectations leave little room for an upside surprise in the current year.
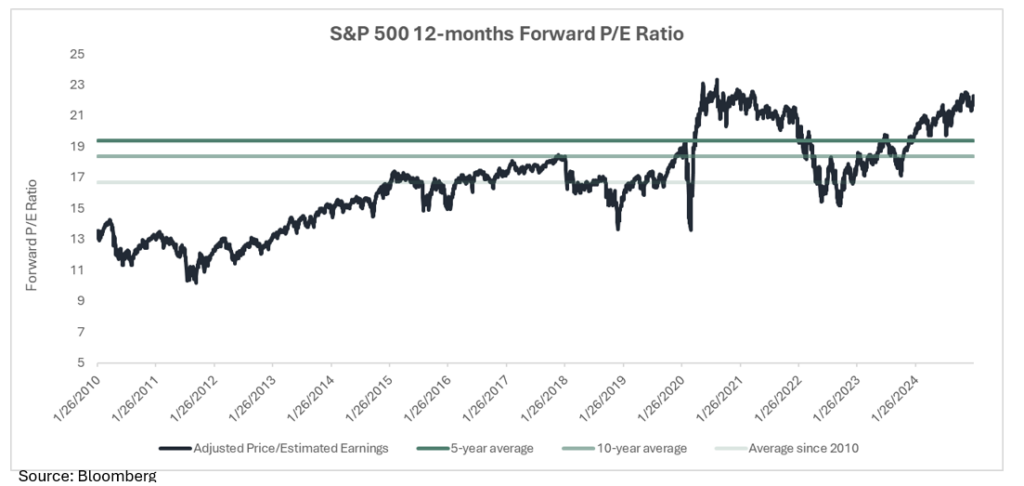
As measured by a forward P/E (price compared to the next 12 months earnings) ratio of 22.3x, this optimism is priced into markets. This level of P/E ratio for the market is firmly in the top decile of expensiveness historically. When combined with the high level of concentration in the market – the top 10 stocks make up 39% of the index – it makes a challenging set up for allocators and investors when looking at the passive, market-cap weighted US Large-Caps indices.14
Putting the earnings estimate and market multiple together allows for two simple questions that help us frame equity market expectations over the course of a year:
- Will the estimated earnings for 2025 materialize and how will 2026 (and beyond) expectations change?
- Will the multiple on estimated earnings expand or contract by the end of the year?
The earnings outlook reflects the economic tailwinds at hand, the technological leaps being made through Artificial Intelligence and its productivity gains across sectors, amongst other benefits that may materialize. Barring a reversal in economic conditions and/or a massive disappointment from Big Tech, the earnings expectations are optimistic, but achievable. The change in the multiple over the course of the year is harder to predict but it’s not prudent to rely on multiple expansion at these levels for equity returns, and if it contracted a couple of turns towards historical averages that would be welcome for longer-term expectations.
All of that being said, US Large-Caps remain the core investment in an equity portfolio because they represent the highest quality market and strongest economic, revenue and profitability outlook and this outweighs the concerns regarding valuations and concentration in the index. The companies that have driven the index to these levels exhibit dominant market positions across multiple sub-industries with defensible competitive advantages. These characteristics, combined with increasing profitability and efficiency fundamentals over time, make the bar extremely high to underweight US Large-Caps. From this neutral view on US Large-Caps we can emphasize certain factors, styles, sizes, and geographies to diversify away from the risks mentioned and pursue the best risk-adjusted return opportunities in the global equity markets.
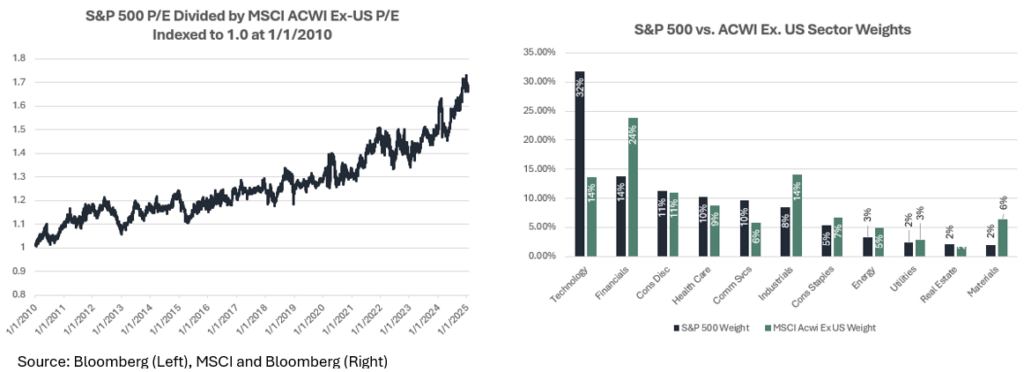
As we have pointed to in the past, the S&P 500 is disproportionately influenced by a handful of large companies, mainly in the Technology sector and in looking beyond those in both the US and globally, we find a still attractive fundamental opportunity set, with less valuation headwinds.
The earnings outlook is likewise strong for the average stock in the S&P 500 when looking at the S&P 500 Equal-Weighted Index, or when looking to small and mid-cap companies and Value stocks in the US. Globally, in developed and emerging markets outside of the US, the estimated earnings growth rate is slower due to the sector composition of those markets and tepid economic growth but still positive – this lower growth rate is reflected in the lower valuations that are found abroad.15
Earnings growth expectations are broad-based across S&P 500 sectors (not just Technology):
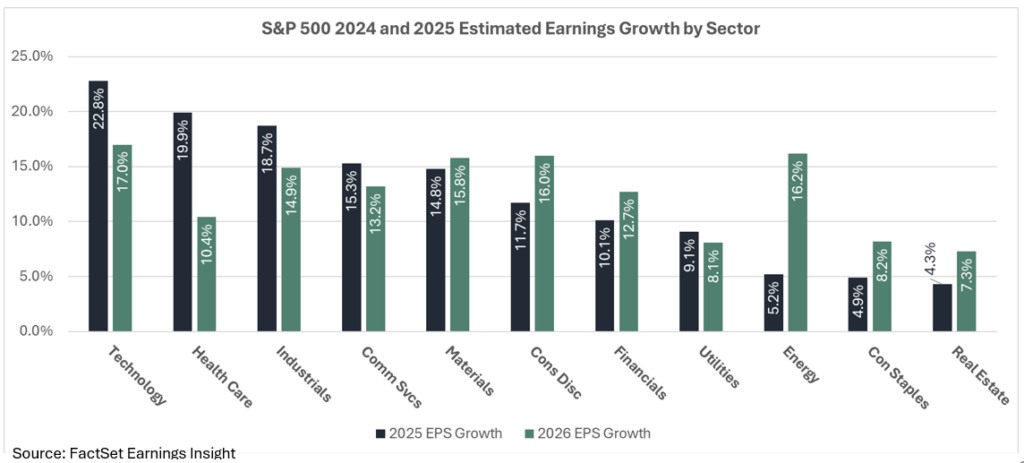
And more tenable valuations can be found beyond the top-heaviness of big Tech in the S&P 500 with comparable future expected earnings growth:
The backdrop of a soft landing and an accommodative Fed is important to Small and Mid-cap stocks that have balance sheet pressure from elevated interest rates. The heavier weighting towards cyclical sectors would logically also tend to benefit these sub classes of equities. The pro-growth and business-friendly regulatory environment of a new administration in the US also favors small and mid-cap companies at the margins due to their domestic focus.
Outside of the US, International stocks (MSCI ACWI ex-US) trade at a 13.8x P/E. The valuation discount between US and International further widened in 2024 and sits at an all-time high. The discount reinforces the case to diversify globally even though the low Technology exposure is a headwind. The cheaper shares are attractive as a complement to the relatively growth-heavy US market.16
The diversification benefits of allocating a portion of the equity portfolio to International stocks are still present. Historically, US and International stocks have traded periods of outperformance even though the past 15 years has been a stellar period for US over International, in part due to foreign currency exchange movements.17 We can’t say with certainty that US stocks will continue to beat International stocks, and are less certain they will beat by the same magnitude given the valuation discrepancy, even as the US remains the best and most reliable stock market for investors globally but we continue to allocate to international stocks, embracing the contrarian nature of rebalancing.
Fixed Income Outlook
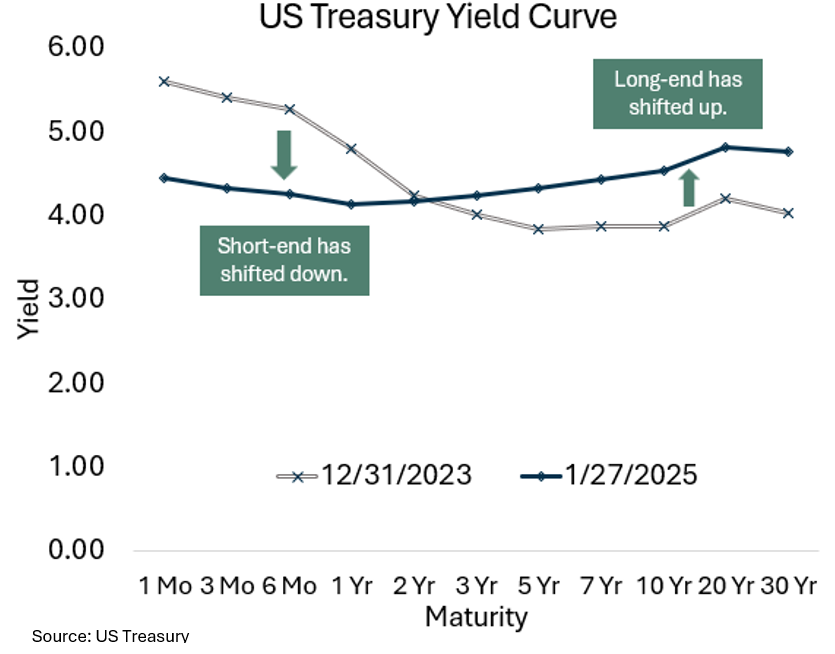
In the fixed income markets, a normalized yield curve and high starting point of yields reinforces bond’s dual role in portfolios as income generator and equity market risk diversifier. The US 10-year Treasury began the year at 4.57%; and after adjusting for expected inflation, it provides real interest income over 2%18. We expect rates to remain volatile but range-bound in light of an uncertain growth and monetary policy outlook. This outlook is made even more uncertain due to pressures on yields regarding the US Federal Deficit and potentially inflationary trade policies. Today’s higher rates reflect this higher growth, higher inflation, and higher uncertainty environment.
Cash rates start the year at approximately 4.5%19 and would be expected to trend downward in the coming years as the Federal Reserve shifts toward a neutral policy stance. The era of zero and negative interest rates appears to be behind us, and higher cash rates are likely to remain a key consideration in asset allocation strategies in the near term.
As cash-equivalent investments like short-term Treasuries and Certificates of Deposit (CDs) that were bought in 2022 and 2023 are coming due, our team views this as an opportunity to deploy the proceeds into traditional fixed income if the time horizon allows it. As we stated last year, bonds tend to outperform cash given the following conditions, according to research from BlackRock:
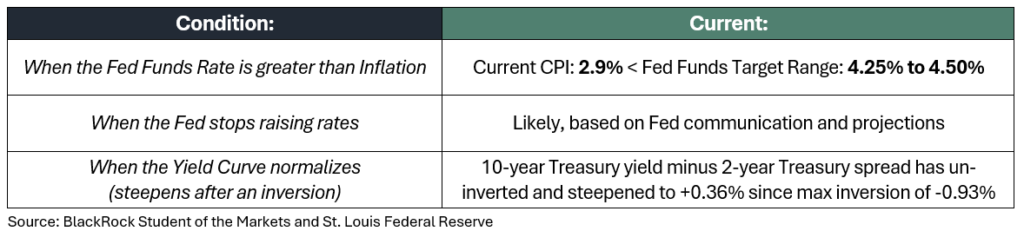
Although these conditions existed in 2024 and bonds lagged cash under the rising rate pressure of the 4th quarter, that new high starting point in yields adds conviction to re-investing in fixed income over cash today. The lasting impact for bond investors from the 2022 meltdown in bonds is that interest rates today provide a cushion that was absent during the zero-interest rate policy (ZIRP) era. An increase in interest rates is less impactful at higher rates when coupon and accretion to par contribute more to the total return calculation. The potential for rates to move higher at these levels makes the opportunity in active fixed income portfolio management and simple laddered individual bond strategies increasingly attractive.
The primary risks associated with rising interest rates stem from the U.S. Federal Deficit and the potential for higher-than-expected inflation, while the risk of an upside surprise in the economy appears small given the already embedded above-trend growth expectations. The Federal deficit continues to exert upward pressure on interest rates, with over $1 trillion in annual interest expense on more than $35 trillion in federal debt.20,21 Political ambition to address the deficit remains low on both sides of the aisle, leaving the situation unresolved. Rating agencies and “bond vigilantes” may further influence rate dynamics, especially if fiscal concerns escalate, underscoring the potential vulnerabilities in the current fiscal and monetary landscape.
Credit markets tightened further in 2024 from already historically tight levels. Large-Cap U.S. companies successfully extended their debt maturities by issuing long-term bonds at favorable rates, delaying any significant “maturity wall” that would theoretically pose challenges in a higher interest rate environment. Investment-grade and high-yield corporate bonds continue to trade at all-time tight spreads relative to Treasuries but still offer incrementally higher yields. Floating-rate instruments such as leveraged loans and private credit/direct lending strategies deliver even higher yield premiums but carry additional risks related to liquidity, complexity, and credit quality. While tight spreads warrant cautious allocations, they remain attractive in the current economic and corporate profit environment. However, today’s narrow spread levels demand heightened selectivity, as a potential spread widening event would negatively impact mark-to-market pricing.
Today’s yield environment provides for better future return expectations compared to a short time ago across sectors and maturities:

The outlook for monetary policy has shifted as we enter 2025. The final meeting of 2024 for the Federal Open Market Committee (FOMC) delivered a 0.25% rate cut, but included projections of just 0.50% worth of reductions in 202522. The Fed Funds Futures market is aligned with the committee projections23 but there is near consensus that the Fed is on “pause” until they get further softness in inflation readings or in the labor market. Our view is that inflation will continue its downward trajectory but there are risks to that outlook – notable potential tariff impacts on goods prices – although, in the previous Trump administration, overall inflation was benign despite tariff activity.
Core PCE, the Fed’s preferred inflation gauge is currently 2.8% as of December 2024 but with the 3- and 6-month annualized rates running at 2.5% and 2.4% respectively, the near-term momentum has slowed. The additional downside that is expected from the abnormally lagged reporting of housing inflation should hit the numbers throughout the year.24 Base effects of high prints in early 2024 will also work in the favor of softness – Core PCE is expected to come in at 2.55% by the January 2025 reading, a significant drop from the 2.8% currently. Trade and immigration policy are wildcards with a new administration, which also contributes to the uncertainty surrounding inflation and will bear watching throughout the year.25
We hope this outlook provides insight into the details we’re examining and the considerations we’re giving to portfolio management on a daily basis at Kavar Capital. We’re looking forward to another year in the markets and thank you for your trust in our team. Please reach out with any questions or comments!
Footnotes:
- Morningstar Direct data
- Bloomberg Data
- Bloomberg Data
- Bloomberg Data
- Federal Reserve https://www.federalreserve.gov/monetarypolicy/files/fomcprojtabl20241218.pdf
- CME Group FedWatch https://www.cmegroup.com/markets/interest-rates/cme-fedwatch-tool.html
- Morningstar Direct data
- Morningstar Direct data
- Federal Bank of St. Louis FRED https://fred.stlouisfed.org/series/VIXCLS
- JPMorgan Guide to the Markets
- “Trend growth” is considered to be 2% in this sentence, this is the recent average for the US real GDP growth post GFC
- Bloomberg Market Data
- Bloomberg Market Data
- Bloomberg Market Data
- Bloomberg Market Data
- Bloomberg Market Data
- Morningstar Direct data
- US Treasury https://home.treasury.gov/resource-center/data-chart-center/interest-rates/
- US Treasury https://home.treasury.gov/resource-center/data-chart-center/interest-rates/
- Federal Bank of St. Louis FRED https://fred.stlouisfed.org/series/A091RC1Q027SBEA
- Federal Bank of St. Louis FRED https://fred.stlouisfed.org/series/GFDEBTN
- Federal Reserve https://www.federalreserve.gov/monetarypolicy/files/fomcprojtabl20241218.pdf
- CME Group FedWatch https://www.cmegroup.com/markets/interest-rates/cme-fedwatch-tool.html
- Federal Bank of St. Louis FRED https://fred.stlouisfed.org/series/PCEPILFE
- Cleveland Fed https://www.clevelandfed.org/indicators-and-data/inflation-nowcasting
The views expressed herein are those of John Nagle on January 31st, 2024 and are subject to change at any time based on market or other conditions, as are statements of financial market trends, which are based on current market conditions. This market commentary is a publication of Kavar Capital Partners (KCP) and is provided as a service to clients and friends of KCP solely for their own use and information. The information provided is for general informational purposes only and should not be considered an individualized recommendation of any particular security, strategy or investment product, and should not be construed as investment, legal or tax advice. Different types of investments involve varying degrees of risk, and there can be no assurance that any specific investment or strategy will be suitable or profitable for a client’s investment portfolio. All investment strategies have the potential for profit or loss and past performance does not ensure future results. Asset allocation and diversification do not ensure or guarantee better performance and cannot eliminate the risk of investment losses. The charts and graphs presented do not represent the performance of KCP or any of its advisory clients. Historical performance results for investment indexes and/or categories, generally do not reflect the deduction of transaction and/or custodial charges or the deduction of an investment management fee, the incurrence of which would have the effect of decreasing historical performance results. There can be no assurances that a client’s portfolio will match or outperform any particular benchmark. KCP makes no warranties with regard to the information or results obtained by its use and disclaims any liability arising out of your use of, or reliance on, the information. The information is subject to change and, although based on information that KCP considers reliable, it is not guaranteed as to accuracy or completeness. This information may become outdated and KCP is not obligated to update any information or opinions contained herein. Articles herein may not necessarily reflect the investment position or the strategies of KCP. KCP is registered as an investment adviser and only transacts business in states where it is properly registered or is excluded or exempted from registration requirements. Registration as an investment adviser does not constitute an endorsement of the firm by securities regulators nor does it indicate that the adviser has attained a particular level of skill or ability.