
Investment Research Note – January 13th, 2022
Courtesy of a 4th quarter rally, stocks finished 2021 on a high note as the US stock market once again displayed resiliency throughout the year. Major benchmarks finished near all-time highs and generally dodged any significant and largescale drawdowns (or volatility scares) while contending with the persistent headwinds of surging inflation, shifting central bank policy, and the (re)surging pandemic.1
Corporations and consumers delivered in a big way during 2021; outpacing the lofty expectations from the COVID-19 vaccine rollout that catalyzed optimism of a near-term return to normalcy. The US stock market was decidedly forward-looking in 2021 – choosing to focus on the robust earnings and growth profiles of domestic companies and their contributions to a broad economic recovery.
Those earnings for the S&P 500 are estimated to finish 2021 higher by an astounding +45.2% – the best year for corporate earnings since 2010, far outstripping the price performance of the index and resulting in more attractive multiples2. S&P 500 companies also set near-term records for Revenue growth and Net Profit Margins reinforcing the narrative that despite all of the external angst, the fundamental view of the underlying companies comprising the index remains strong.3
As we enter 2022, prices for risk assets are certainly elevated after three consecutive years of above average returns.4 However, valuations remain somewhat in check due to the historic rise in earnings for 2021 and elevating estimates for 2022.5 To start the year, the S&P 500 is trading at roughly 21.2 times this year’s earnings6 – not cheap historically but also not at past extremes. When considering the low interest rate environment and the composition of the index’s industry sectors, it not excessive in our estimation.
The economy’s recovery continues with fits and stops related to the pandemic but with the caveat that stimulative measures are fading away. The Federal Reserve and other central banks globally will be a major focus as they taper asset purchase measures and chart the path of interest rates — this transition is already underway.
4th Quarter 2021 and Full Year Review
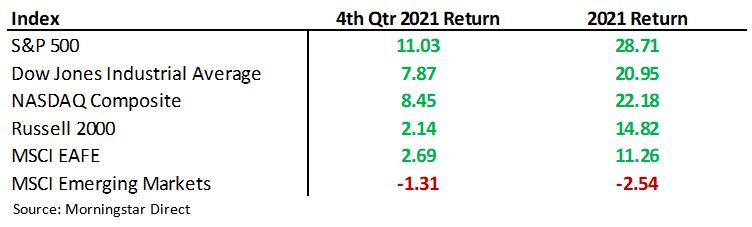
US broad market indices all exhibited strong returns for the 4th quarter and for the year. The S&P 500 finished 2021 with a total return of +28.71% after registering 70 closing all-time highs (the most since 1995, which saw 77)7,8. The Dow Jones Industrial Average was up +20.95%, trailing the S&P 500 for the third straight year.9
While underlying segments moved in and out of favor throughout the year, the max drawdown for the S&P 500 from a closing high was only -5.12%.10 For reference, the average intra-year decline is 14% in any given calendar year going back to 1980.11 As the headline index was buoyed at nearly all times, the average component in the S&P 500 experienced a drawdown of -11.8% during the year demonstrating the volatility that appeared in different areas of the market at different times.12
The Tech-heavy NASDAQ Composite for instance, experienced a -10.49% drawdown in the first quarter but rebounded to finish the year +22.18%. 2021 was the first year since 2016 that the NASDAQ underperformed the S&P 500.13
Small Caps stocks were positive again after a strong 2020 but trailed Large Caps: the Russell 2000 Index finished up +14.82% for 2021. Small Caps experienced a strong rebound from the re-opening trade but stumbled on news of the Omicron variant. 14
International stocks again trailed the US counterparts, the MSCI EAFE (developed countries) was up +11.26% for the year while the MSCI Emerging Markets Index finished down for the year -2.54% – one of the few corners of the global equity markets that failed to deliver positive results. China, by far the heaviest weighted country in the Emerging Markets Index, negatively affected the index returns as the MSCI China Index was down -16.05% for the year.15
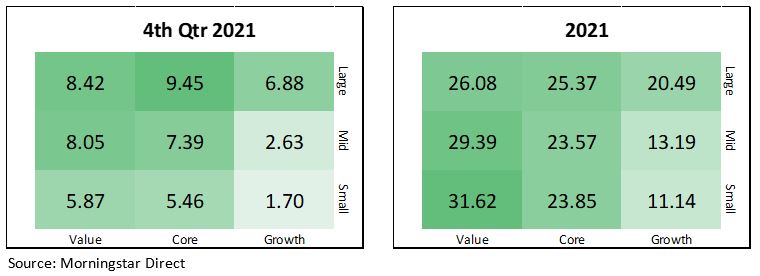
Value outperformed Growth in the Morningstar Style Box category averages last year for the first time since 2016 as the re-opening trade triggered a large performance gap in the first quarter of the year. Growth stocks, particularly in the Mid and Small Cap areas saw multiple compression throughout the year with higher rates and inflation weighing on valuations.16
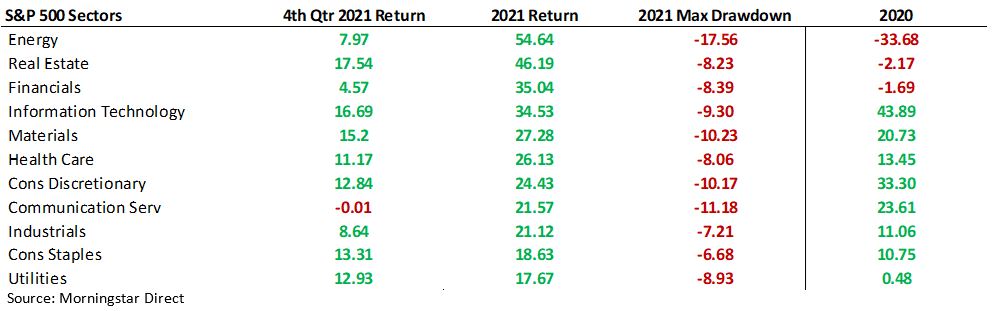
Typical Value-oriented sectors: Energy, Real Estate and Financials were the top three S&P 500 sectors for the year after being the three worst performers, and only negative sectors, the year before. Technology stocks continued to produce strong returns: +34.53% for the year after a stellar 4th quarter.17
Overall performance for diversified equity portfolios was strong in 2021 including contributions across market caps, styles, sectors, and geographies, with Emerging Markets being the major notable exception. The long-awaited rotations out of strength and into weakness – Large-caps to Small-caps, Growth to Value, US to International – showed some signs of sticking but none completely took hold during 2021.
Fixed Income
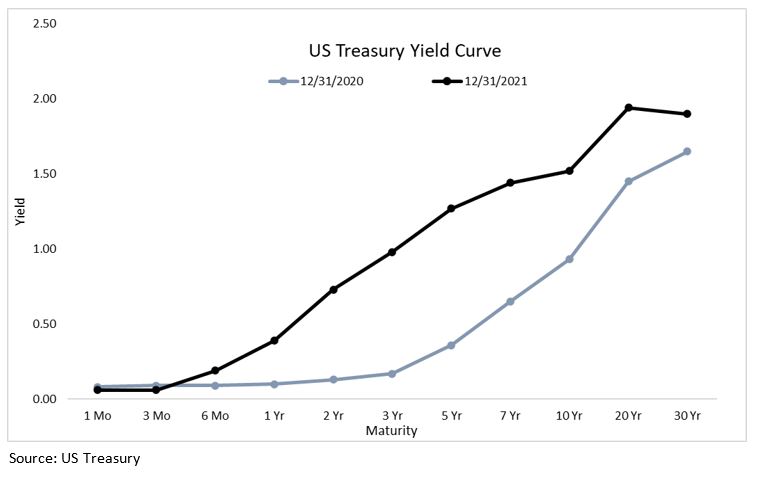
Yields expectedly rose across the board given the low starting point, ongoing economic recovery, pivoting Fed policy and rising inflation data. What was unexpected to us, given all of those developments, was that the rise in yields was rather orderly and not of great magnitude: the 10-year Treasury moved from 0.92% at the start of 2021 to 1.51% at the end with a high of only 1.77% during the year.18 This move came in conjunction with an increase in the Consumer Price Index (CPI) of +7.12% over 2020, the highest level for this inflation measure since 1981.19 Additionally, the Fed Funds Futures market is now pricing in at least three rate hikes during 2022. If the bond market is still a reliable signal to investors, it surely does not appear to believe that extremely high inflation will be a persistent phenomenon.
Plain vanilla fixed income assets struggled under the pressure of rising rates in 2021: the Bloomberg US Aggregate Bond Index fell for just the third calendar year since 1980 and the first time since 2013 finishing the year -1.54%. Investment Grade Corporate Bonds, as measured by the Markit iBoxx Liquid Investment Grade index, lost -1.49% while the Bloomberg Municipal Index held in well and gained +1.52% for the year. Treasury Inflation Protected Securities (TIPS) shined as inflation measures spiked: the S&P US Treasury TIPS index returned +5.79% for the year.20
Riskier areas of US credit were mainly positive as spreads narrowed and capital flowed to higher yielding areas. The Bloomberg High Yield Corporate Index and the Credit Suisse Leverage Loan Index returned +4.53% and +4.63%, respectively.21
Ex-US bonds were generally underperformers during the year as local-currency denominated bonds were hindered by a rising US Dollar, in particular Emerging Market issues: the JPM GBI-EM Diversified Composite, the benchmark for local currency EM bonds slumped -9.71% for the year.22
As we make our way through the first part the new year, we’ll be expounding on some of the topics within this note in more detail. The year ahead projects to be an eventful one in the markets whether its by way of the aforementioned dynamics of inflation, Fed policy and market valuations or by the inevitable shakeup of market calm by something under the radar as of now. Please reach out with any questions or concerns at any time!
The views expressed herein are those of John Nagle on January 13th, 2022 and are subject to change at any time based on market or other conditions, as are statements of financial market trends, which are based on current market conditions. This market commentary is a publication of Kavar Capital Partners (KCP) and is provided as a service to clients and friends of KCP solely for their own use and information. The information provided is for general informational purposes only and should not be considered an individualized recommendation of any particular security, strategy or investment product, and should not be construed as, investment, legal or tax advice. Different types of investments involve varying degrees of risk, and there can be no assurance that any specific investment or strategy will be suitable or profitable for a client’s investment portfolio. All investment strategies have the potential for profit or loss and past performance does not ensure future results. Asset allocation and diversification do not ensure or guarantee better performance and cannot eliminate the risk of investment losses. Charts and graphs presented do not represent the performance of KCP or any of its advisory clients. Historical performance results for investment indexes and/or categories, generally do not reflect the deduction of transaction and/or custodial charges or the deduction of an investment management fee, the incurrence of which would have the effect of decreasing historical performance results. There can be no assurances that a client’s portfolio will match or outperform any particular benchmark. KCP makes no warranties with regard to the information or results obtained by its use and disclaims any liability arising out of your use of, or reliance on, the information. The information is subject to change and, although based on information that KCP considers reliable, it is not guaranteed as to accuracy or completeness. This information may become outdated and KCP is not obligated to update any information or opinions contained herein. Articles herein may not necessarily reflect the investment position or the strategies of KCP. KCP is registered as an investment adviser and only transacts business in states where it is properly registered or is excluded or exempted from registration requirements. Registration as an investment adviser does not constitute an endorsement of the firm by securities regulators nor does it indicate that the adviser has attained a particular level of skill or ability.
Footnotes:
- Morningstar Direct Data
- FactsSet Earnings Insight https://www.factset.com/hubfs/Website/Resources%20Section/Research%20Desk/Earnings%20Insight/EarningsInsight_010722A.pdf
- FactSet Earnings Insight https://www.factset.com/hubfs/Website/Resources%20Section/Research%20Desk/Earnings%20Insight/EarningsInsight_010722A.pdf
- Morningstar Direct Data
- FactSet Earnings Insight https://www.factset.com/hubfs/Website/Resources%20Section/Research%20Desk/Earnings%20Insight/EarningsInsight_010722A.pdf
- JPMorgan Guide to the Markets as of 12/31/21 https://am.jpmorgan.com/content/dam/jpm-am-aem/global/en/insights/market-insights/guide-to-the-markets/mi-guide-to-the-markets-us.pdf
- Morningstar Direct Data
- Compound Advisors “2021: The Year in Charts” https://compoundadvisors.com/2022/2021-the-year-in-charts
- Morningstar Direct Data
- Morningstar Direct Data
- JPMorgan Guide to the Markets as of 12/31/21 https://am.jpmorgan.com/content/dam/jpm-am-aem/global/en/insights/market-insights/guide-to-the-markets/mi-guide-to-the-markets-us.pdf
- Morningstar Direct Data
- Morningstar Direct Data
- Morningstar Direct Data
- Morningstar Direct Data
- Morningstar Direct Data
- Morningstar Direct Data
- US Treasury https://www.treasury.gov/resource-center/data-chart-center/interest-rates/Pages/TextView.aspx?data=yieldYear&year=2021
- U.S. Bureau of Labor Statistics, Consumer Price Index for All Urban Consumers: All Items in U.S. City Average [CPIAUCSL], retrieved from FRED, Federal Reserve Bank of St. Louis; https://fred.stlouisfed.org/series/CPIAUCSL
- Morningstar Direct Data
- Morningstar Direct Data
- Morningstar Direct Data