
Investment Research Notes – January 3, 2020
2019 Review:
Strong returns for stocks continued in the 4th quarter of 2019, capping off one of the best years in recent memory. The S&P 500 gained +31.49% on a total return basis for the year. Following a brutal 4th quarter (especially the month of December) for investors in 2018, the rebound to fresh all-time highs was a welcome development. The S&P 500 has rallied nearly 40% since the bottom on Christmas Eve 2018.1
The 30%+ year was the 15th in the 85-year history for the S&P 500 and was the 4th best year for the index since 1990 – bested only by 1995, 1997, and 2013 on a total return basis. The other major US benchmarks – the Dow Jones Industrial Average and the NASDAQ Composite – gained +25.34% and +36.69% respectively for the year.2
In further contrast to 2018, which had two distinct drawdowns of -10.10% and -19.36%, the largest drawdown during 2019 was only -6.62%. It was also short-lived – lasting from May 4th to June 3rd.3 That -6.62% drop is less than half the average intra-year drop of -13.8% over the past 40 years.4
International stocks were also positive but continued the trend of underperforming those from the US. The MSCI EAFE index, representing developed markets abroad, gained +22.01% in total return for the year, while the MSCI EM Index, representing emerging economies, gained +18.42% in total return.5 The US dollar rose slightly against global currencies, as the Trade Weighted US Dollar Index rose 0.8% during 2019.6
The bond market also produced strong returns. The Bloomberg Barclays US Aggregate Bond index posted a +8.72% total return, marking it’s best calendar year since 2002.7 As the Fed cut rates 3 times during the year, the 10-year Treasury yield fell from 2.69% at the end of 2018 to an intra-year low of 1.47% on August 28th, before settling at 1.92%.8
Along with falling yields, credit spreads tightened, contributing to fixed income returns. High Yield spreads moved from 533 basis points (bps) to 360 bps over Treasuries and Investment Grade spreads moved from 202 bps to 129 bps over Treasuries at the end of 2019.9
Given the combined strength of US stocks and bonds, the stalwart 60/40 portfolio (60% stocks, 40% bonds) generated its best year since 1997 – another instance of a roaring stock market coupled with falling Treasury yields.10
Equities:
Sector, Style and Geographic Returns:
The Tech sector gained over 50% during 2019 to lead all sectors, followed by Communication Services and Financials.11
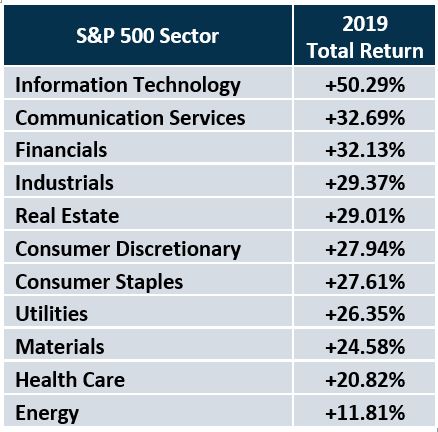
Healthcare stocks trailed the market during the full year as some political noise surrounding potential 2020 Democratic nominees and their policies dragged on certain areas of the industry. However, that sector ended the year well – posting the 2nd best return for the 4th quarter.12
Energy lagged substantially below all other sectors and the broad market, returning only +11.81%. The Bloomberg Commodity Index posted a +7.69% for the year.13 Crude oil prices rose. West Texas Intermediate crude (WTI) price per barrel ended 2019 at $61.06/barrel, booking a +34.5% gain for the year, the best year since 2016. Natural Gas prices fell precipitously for the year. The Bloomberg Natural Gas Index dropped 37.24% during 2019.14 Energy MLPs, as represented by the Alerian MLP Index, dropped during the 3rd and 4th quarters of 2019, by -5.02% and -4.08% respectively, and finished the year with a gain +6.56% in total return.15
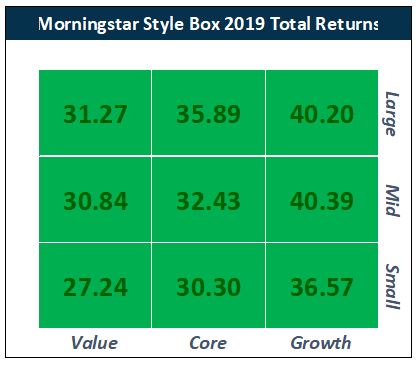
Growth stocks outperformed their Value counterparts again in 2019 – the third consecutive year – with the tailwind of strong performance in the Technology sector. Likewise, Large Cap companies outperformed Small Caps for the third straight year. Mid Cap Growth was the best performing style box for the full year. Also for the third straight year, Small Cap Value stocks were the worst performing sub-class of equities.16
Internationally, Developed countries outpaced Emerging countries, led by strong performances in Europe – specifically Switzerland, Netherlands and Ireland markets – all saw gains in excess of the US. The United Kingdom markets dealt with the continued Brexit debate and elections late in the year and finished up +23.16%. Japan’s market finished with a gain of 19.56%.17
The ongoing US-China trade tensions, the ebb and flow of a potential trade deal and the turmoil in Hong Kong heavily influenced the Emerging Markets benchmark. Russian and smaller component Greek markets saw the largest gains in Emerging Markets, gaining +50.61% and +55.76% respectively.18
Drivers of Returns:
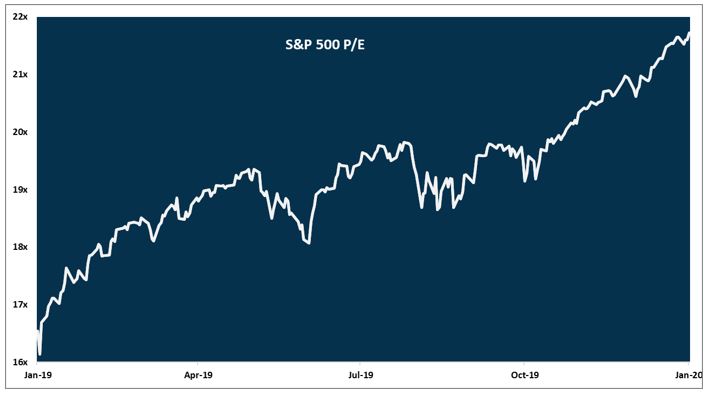
The main driver of 2019’s return was multiple expansion. The Price-to-Earnings (P/E) ratio rose from 16.5x to 21.7x as earnings were basically flat for 2019. Of course, this comes on the heels of 2018 where strong earnings growth was offset by stock price declines and multiple contraction for the first time since 2011.19
Shareholder yield continues to be a steady driver of stock returns. For 2019, the S&P 500 produced a 4.1% total shareholder yield – composed of a 1.8% dividend yield and 2.3% buyback yield. This yield plus the above referenced multiple expansion comprises 2019’s return to investors in the S&P 500. Earnings growth will have essentially contributed zero to 2019’s return.20
Fund Flows and Sentiment:
In spite of the great year for US equities, investor sentiment remained cautious, as per the data measuring fund flows. Through the end of November 2019, US equity focused mutual funds and ETFs saw net outflows of nearly $39 billion while taxable and municipal bond mutual funds and ETFs saw massive net inflows of roughly $459 billion……in spite of cratering yields.21
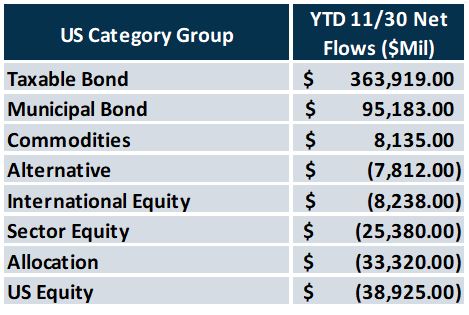
While these numbers are not all-encompassing, it does indicate that the behavior of investors and advisors is far from euphoric. It actually leaned towards safety throughout the year as well as rebalancing out of strong stock returns.
Fixed Income:
As rates fell and credit spreads tightened during the year, fixed income prices rose. US Municipal bonds posted a total return of +7.54% for the year. Credit was especially strong, Investment Grade Corporates returned +17.27% while High Yield Corporates returned +14.75% for the year. Emerging Market bonds also performed strongly, with the index posting a +12.43% return after a rough 2018 for the space. Even Bank Loans, which typically have little sensitivity to interest rates, rallied during the year, returning +9.33%.22
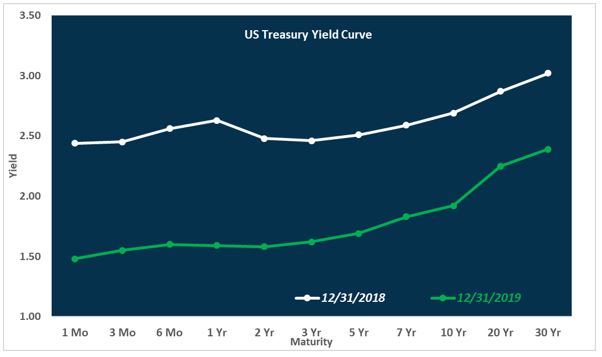
The yield curve shifted down throughout 2019 across all maturities. And while the yield curve inversion during the year spooked investors, the curve ultimately was steeper at the end of the year compared to the end of 2018 after the Fed cut their target rate three times, pressuring the short end.23
– John Nagle, CFA
The views expressed herein are those of John Nagle on January 3, 2020 and are subject to change at any time based on market or other conditions, as are statements of financial market trends, which are based on current market conditions. This market commentary is a publication of Kavar Capital Partners, LLC (KCP) and is provided as a service to clients and friends of KCP solely for their own use and information. The information provided is for general informational purposes only and should not be considered an individualized recommendation of any particular security, strategy or investment product, and should not be construed as, investment, legal or tax advice. Different types of investments involve varying degrees of risk, and there can be no assurance that any specific investment or strategy will be suitable or profitable for a client’s investment portfolio. All investment strategies have the potential for profit or loss and past performance does not ensure future results. Asset allocation and diversification do not ensure or guarantee better performance and cannot eliminate the risk of investment losses. Charts and graphs presented do not represent the performance of KCP or any of its advisory clients. Historical performance results for investment indexes and/or categories, generally do not reflect the deduction of transaction and/or custodial charges or the deduction of an investment management fee, the incurrence of which would have the effect of decreasing historical performance results. There can be no assurances that a client’s portfolio will match or outperform any particular benchmark. KCP makes no warranties with regard to the information or results obtained by its use and disclaims any liability arising out of your use of, or reliance on, the information. The information is subject to change and, although based on information that KCP considers reliable, it is not guaranteed as to accuracy or completeness. This information may become outdated and KCP is not obligated to update any information or opinions contained herein. Articles herein may not necessarily reflect the investment position or the strategies of KCP. KCP is registered as an investment adviser and only transacts business in states where it is properly registered or is excluded or exempted from registration requirements. Registration as an investment adviser does not constitute an endorsement of the firm by securities regulators nor does it indicate that the adviser has attained a particular level of skill or ability.
Footnotes:
- Morningstar Direct Data
- Morningstar Direct Data
- Morningstar Direct Data
- JPMorgan Guide to the Markets https://am.jpmorgan.com/blob-gim/1383407651970/83456/MI-GTM_1Q20.pdf
- Morningstar Direct Data
- Federal Reserve Bank of St. Louis (FRED Economic Data) https://fred.stlouisfed.org/series/TWEXB
- Morningstar Direct Data
- US Treasury https://www.treasury.gov/resource-center/data-chart-center/interest-rates/pages/TextView.aspx?data=yieldYear&year=1997
- Federal Reserve Bank of St. Louis (FRED Economic Data) https://fred.stlouisfed.org/series/BAMLH0A0HYM2 and https://fred.stlouisfed.org/series/BAMLC0A4CBBB
- Morningstar Direct Data
- Morningstar Direct Data
- Morningstar Direct Data
- Morningstar Direct Data
- MarketWatch https://www.marketwatch.com/story/oil-slumps-into-final-session-as-traders-prepare-to-cap-bullish-year-for-crude-2019-12-31
- Morningstar Direct Data
- Morningstar Direct Data
- Morningstar Direct Data
- Morningstar Direct Data
- Bloomberg Market Data
- JPMorgan Guide to the Markets https://am.jpmorgan.com/blob-gim/1383407651970/83456/MI-GTM_1Q20.pdf
- Morningstar Direct Data
- Morningstar Direct Data
- US Treasury https://www.treasury.gov/resource-center/data-chart-center/interest-rates/pages/TextView.aspx?data=yieldYear&year=1997