
Investment Research Note – July 24th, 2019
2nd Quarter Review:
The recovery from the messy 4th quarter of last year ultimately grinded on during the 2nd quarter of this year for US stocks. For the quarter, the S&P 500 finished up +4.30% taking the year to date total return to up +18.54%, the best first half for the index since 1997. The S&P 500 was up +7.05% during June alone, the best June for the index since 1955. This bounceback came after the only negative month all year, as May saw weakness in stocks partially due to lingering concerns around global trade and economic growth. All time highs were breached for the S&P 500 during June and have continued past the symbolic 3,000 level early on in the 3rd quarter. The Dow Jones Industrial Average and NASDAQ Composite joined in with all-time highs during July.1
Two general and ongoing developments have steered markets for the first six months of the year: the Fed completing its all-out pivot from tightening to easing monetary policy and the US-China trade tensions.
The Fed’s policy path has radically changed over the past 12 months; presumably halting rate hikes for the time being in favor of “insurance” rate cuts. This is an attempt to foster inflation and stave off an economic slowdown – allowing the now record expansion to continue. The end of this quarter officially stamped this expansion the longest (albeit not the strongest) in US history, at 121 months.2 All records bring about a chorus of concern regarding when it will end but its length is actually arbitrary. The economy won’t roll over because it has exceeded a pre-imposed time limit; it will falter due to excesses that build up and break down. It’s more important for investors to identify those excesses and avoid the fallout of a contraction than it is to estimate the duration of an expansion.
Equity markets have read the “dovish” pivot by the Fed as the central bank’s commitment to exten ding the economic expansion – using all tools at its disposal. Martin Zweig’s famous mantra: “Don’t fight the Fed” is resonating right now. Fundamentally, the Fed is walking a tighrope between being supportive and being suspicious: supportive of low interest rates which are a strong incentive to own equities and to allow companies to invest into their businesses (or reward shareholders) and suspicious of knowing something investors don’t know about the delicacy of the economy’s underpinnings. This balancing act of will likley be the most closely watched development for the rest of the year.
Equities:
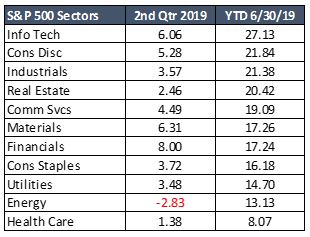
The 2nd quarter saw fairly-broad based participation in the rally, with Energy the lone sector to post a negative total return. Financials were the strongest sector, with a +8.00% quarter receiving a tailwind from a steepening yield curve. Year-to-date Technology stocks continue to lead, with their total return sitting at +27.13% as of 6/30/19. Healthcare remains the laggard for the year, underperforming all sectors at +8.07% for the first six months. Rising political rethoric, with the looming 2020 elections, contributed to the relative weakness in healthcare stocks.3
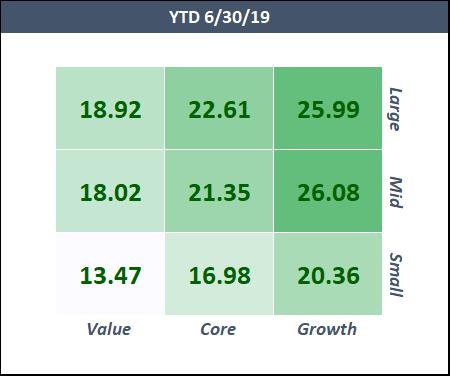
Growth stocks continued to beat Value stocks as the Russell 3000 Growth index is now outperforming the Russell 3000 Value index by +5.36% year-to-date4. The past five years have been extrememly challenging for Value investors and the recognition of such has illicited recent headlines like: “Is value investing dead? It might be and here’s what killed it” on CNBC.5 As of 6/30/19, the Russell 1000 Growth index outperformed the Russell 1000 Value index by 44.2% cumulatively over the past five years.6
Large Cap stocks outpaced Small Cap stocks, as the Russell 2000 index posted a +2.10% quarter.5 Small Cap stocks have returned +16.98% for the year.7
Globally, stocks outside of the US continued to underperform, although the majority still saw positive returns. Emerging Markets stocks, heavily influenced by China, experienced a bout of volatility in May surrounding trade tensions but rallied in June to break even for the quarter. So far this year, the MSCI Emerging Markets Index is up +10.58%. China equities lost -12.9% during May and -4.11% for the 2nd quarter, pulling back from a strong 1st quarter of the year.8
Developed International markets are also positive for the year, at +14.03%.9 Europe and the UK continue to grapple with Brexit over 3 years after the initial referendum and sluggish economies, particularly Germany, should be on the radar for the rest of the year. In June, policy makers at the European Central Bank (ECB) signaled stronger stimulus, (possibly rate cuts and/or asset purchases), was on tap for the region as inflation and growth remain stubborn.10
Fixed Income:
The Bloomberg Barclays US Aggregate Index had another strong quarter, finishing up +3.08%, as the benchmark 10-year treasury yield fell throughout the quarter and settled right at 2% on June 28th. This short-term performance for the broad investment grade bond index is historically strong. The six month period from December 2018 to May 2019 was the strongest six months for the Bloomberg Barclays US Aggregate Index since the depths of the Global Financial Crisis – the period ending April 2009.11

The flight to quality comes as global investors increasingly see US bonds as the one of the few true safe havens available. Investors have poured over $247 billion on a net flow basis into Taxable and Municipal bond mutual funds and ETFs so far in 2019. To put in perspective, investors have barely added to Equity funds during the year, adding less than $1 billion on a net flow basis. This discrepancy is an amazing representation of current sentiment given the strong performance and all-time highs seen for US stocks.12
Credit remained strong as spreads remained tight during the quarter. The Bloomberg Barclays High Yield Index is up +9.94% through 6/30/2019, Investment Grade issues are up +11.96% and the Credit Suisse Bank Loans ended up +5.42%.13
2nd Half Outlook:
Earnings fell in the 1st quarter by -0.4% compared to the 1st quarter of 2018, the first quarterly decline since 2016. Earnings are also forecasted to decline for the 2nd quarter as companies begin to report in earnest this week. For the 2nd quarter, the decline is estimated to be -1.9% according to FactSet.14 As a comparable for this year’s earnings, 2018 is proving to be a high bar for companies to beat as tax cuts boosted bottom lines. It should come as expected that earnings growth may take a pause or a slight step back when viewed in the light of last year’s jump. Nonetheless, earnings season will be closely monitored as a significant surprise to the upside or downside for corporate profits will be a harbinger of market health, considering the angst surrounding an economic slowdown.
Valuations can best be described as “fair” today as they are right on top of the 25-year average as of 6/30/19; the S&P 500’s forward price-to-earnings (P/E) ratio is 16.7x compared to the historical average of 16.2x.15 Using these valuations as a starting point for the 2nd half of the year and taking into consideration the likelihood of a pause in earnings growth, investors may need multiple expansion to drive any forthcoming increases in stock prices.
Economic growth has persisted so far this year and the expansion from the 2009 lows is now the longest in US history. However, the outlook has become slightly muddled during the 2nd quarter as some data showed signs of deterioration. The 1st quarter of this year beat expectations and printed +3.2% growth from the previous year’s 1st quarter boosted by an inventory build-up and net exports. Expectations for the 2nd quarter are more modest but still positive.16
The Atlanta Fed’s GDPNow forecast stands at +1.6% growth for the 2nd quarter as of July 17th.17 On the positive side is the historically strong job market, where the unemployment continues to drop, now standing at 3.7%. This strong job market has led to continued strength of the consumer with real spending and retail sales surprising to the upside in the latest releases. On the negative side, there has been a slowdown in the ISM numbers, particularly in the manufacturing index as well as in durable goods orders.19
The market’s strong first half of the year was a welcome recovery from the dreadful end of 2018 and while the easing Fed is pushing the market back to the TINA (There Is No Alternative) mindset regarding stocks. It stands to reason that volatility will show up again at some point during the second half. There are many developments to keep watching from the trade tensions to earnings seasons to economic data points and down the road the looming 2020 election campaigns that will shape the rest of the year.
– John Nagle, CFA
The views expressed herein are those of John Nagle on July 24th, 2019 and are subject to change at any time based on market or other conditions, as are statements of financial market trends, which are based on current market conditions. This information is provided as a service to clients and friends of Kavar Capital Partners, LLC solely for their own use and information. The information provided is for general informational purposes only and should not be considered an individualized recommendation of any particular security, strategy or investment product, and should not be construed as, investment, legal or tax advice. Past performance does not ensure future results. Kavar Capital Partners, LLC makes no warranties with regard to the information or results obtained by its use and disclaims any liability arising out of your use of, or reliance on, the information. The information is subject to change and, although based on information that Kavar Capital Partners, LLC considers reliable, it is not guaranteed as to accuracy or completeness. This information may become outdated and we are not obligated to update any information or opinions contained herein. Articles may not necessarily reflect the investment position or the strategies of our firm.
Footnotes:
- Morningstar Direct Data
- CNBC
https://www.cnbc.com/2019/07/02/this-is-now-the-longest-us-economic-expansion-in-history.html
- Morningstar Direct Data
- Morningstar Direct Data
- CNBC
https://www.cnbc.com/2019/06/21/is-value-investing-dead-it-might-be-and-heres-what-killed-it.html
- Morningstar Direct Data
- Morningstar Direct Data
- Morningstar Direct Data
- Morningstar Direct Data
- Bloomberg
- Morningstar Direct Data
- Morningstar Direct Data
- Morningstar Direct Data
- FactSet Earnings Insight as of 7/19/19 https://www.factset.com/hubfs/Resources%20Section/Research%20Desk/Earnings%20Insight/EarningsInsight_071919.pdf
- JPMorgan Guide to the Markets as of 6/30/19
- JPMorgan Guide to the Markets On the Bench as of 6/30/19
- Atlanta Federal Reserve
https://www.frbatlanta.org/cqer/research/gdpnow.aspx
- JPMorgan Guide to the Markets On the Bench as of 6/30/19