
Investment Research Note – October 11th, 2023
Markets retreated to close out the 3rd quarter of the year, interrupting the strong rally off the lows of 2022 that persisted for the first seven months of 2023. Rising interest rates pressured stocks and bonds in a recall to the environment of last year where both asset classes declined simultaneously in a departure from the historical relationship between the two.
Treasury yields broke through to 16-year highs in September, intensifying market declines, resulting in the worst month of the year for the S&P 500 (-4.77%) and the Bloomberg US Aggregate Bond Index (-2.54%).1
THE SHIFTING YIELD CURVE AND ITS IMPLICATIONS
The long-end of the curve is not as well understood as the short-end. The short-end responds mainly to changes in monetary policy while moves in the long-end are more ambiguous. As the long-end has moved up so aggressively many have rightfully taken a deep dive into what the move is about.
To begin though, we have to note what the move in rates isn’t about because it is a key input to today’s investment discourse. Looking at inflation break-even rates, the market is not pricing in a flare up of inflation as one may expect with a rise in rates.
The 10-year breakeven inflation rate for the TIPS (Treasury Inflation Protected Securities) market is 2.31% as of 10/6/23, just slightly higher than it was to start the year. The short-term 5-year breakeven rate has actually fallen through the year to its lowest rate since early 2021.2
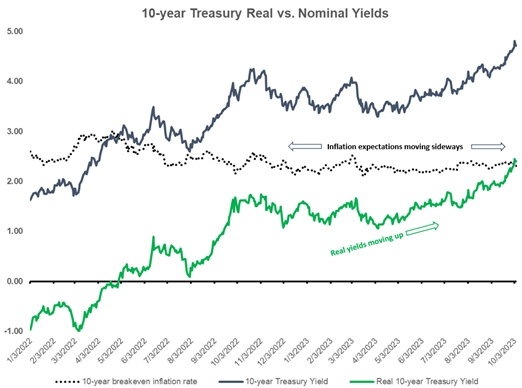
This tells us the increase in bond yields during September was not due to increasing inflation expectations, a key input for the Federal Reserve and something they should be applauding. It has been an increase in “real” bond yields (nominal yields minus expected inflation). Inflation measures have continued to decline towards the Fed’s target of 2% and expectations have remained in check – this is critical for the Fed to begin the end of the rate hike cycle.
So, if it’s not inflation, the next steps are examining what the move is about and the answer has foundational impacts on markets and is likely more important than the actual level of interest rates. Several theories are permeating through the market:
- Reaction to Fed policy: the bond market is coming around to the “higher for longer” scenario that the Fed has been angling towards as they drive to the end of their rate hiking initiative. The theory goes that the market was stubbornly positioned for rates cuts to happen sooner rather than later and is now pricing those cuts out and pricing in tight policy over a longer time period.
This is logical and is partially explained in the data. From July 13th to the end of the 3rd quarter, the futures market implied Fed Funds rate for December 2024 (what the bond market is positioning for) rose from 3.76% to 4.74%.3
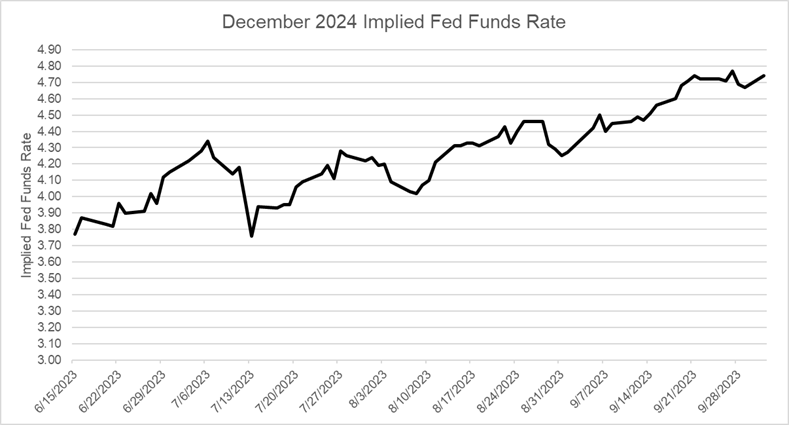
But the problem with this is that the 2-year Treasury yield has barely budged while the long-end has increased significantly.4 So, there is some disconnect between this theory and what is playing out in the market. It doesn’t tell the whole story.
- An improving economic growth outlook: the simplest explanation is that growth expectations for the US have improved. The US 10-year Treasury yield for example is closely linked to US nominal GDP growth over time, albeit unsteadily on a short-term basis.
For some reason market pundits seem eager to dismiss this possibility (maybe because it is too simple in nature or too optimistic), but the economic growth outlook has definitively improved during 2023. On October 17th, 2022 a Bloomberg economists’ model was released citing a 100% chance of a recession over the next 12 months, something that never materialized5. Rather than even slow-down though, the economy has seemingly accelerated during the 2nd half of the year, with the latest projection from the Atlanta Fed GDPNow model forecasting +5.1% real GDP growth in the just completed 3rd quarter, which would be the best quarter since Q4 of 2021.6
Along with a continually strong labor market – the US has added over 2.3 million jobs during 20237 – the economy remains on solid ground despite the conventional wisdom regarding the Fed’s tightening cycle and the market could just simply be pricing in the increasing likelihood of a “soft landing” after the Fed sharply upgraded its own economic outlook in early September.
- US borrowing costs are increasing: A school of thought exists that the rise in rates is in response to a degradation of US credit worthiness. In 2023 alone the US has had an intense debt ceiling debate go way to close to the default deadline, an outright downgrade of its sovereign credit rating by the rating agency Fitch, a narrowly avoided government shutdown and all of this alongside an ever deepening fiscal deficit. Perhaps the market is forcing the US to pay higher rates to account for the political risks and the burden of debt.
This theory is hard to prove out conclusively with data but we can observe the spread between US Treasuries and sovereign debt of other developed countries. We can see that at current yields, US Treasuries are trading relatively riskier than average vs. multiple other major countries bonds8:
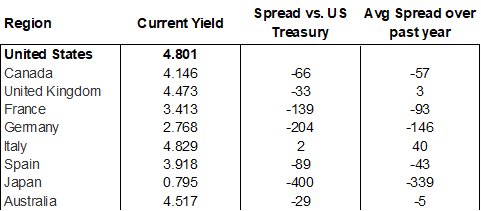
Factors like currency exchange rates, inflation, central bank policy, and other dynamics influence bond yields from one country to another; so, while in a vacuum this might seem like a step back in creditworthiness for the US it isn’t that straightforward.
The bottom line is the US has issued a ton of debt in its history and ramped it up even more over the past few years to stimulate the economy and that, coupled with the glaringly obvious political disfunction, contributes to the negative view of US-issued bonds. Even though those two broad concerns are nothing new to America, they could theoretically contribute to higher rates if global investors begin to demand a higher risk premium.
- Other Technical Factors: there are other factors at play that may point to supply/demand mismatches for long Treasuries that are pushing up yields through the “term premium” that is paid on the long-end of the curve.
First, the yield curve should naturally slope upwards (longer yields higher than shorter yields) as an investor should be compensated for locking up capital for a longer time. The movement up on the long-end could be a self-correcting shift as the higher short-end becomes more solidified by tighter for longer monetary policy and the market naturally un-inverts the curve to allocate risk appropriately
The other factors including the level of short-term Treasury issuance (there’s been A LOT lately), ongoing quantitative tightening from the Fed, other global central bank activity, a pulling back from significant foreign investors like China, among others are there and these likely have some impact on the market but are not well understood in their real-world impacts and hard to tease out in data.
In our view, the first two rationale – adjusting to Fed policy and a factoring in a more prosperous nominal economic growth picture – make up the bulk of the move in rates and more importantly represent cyclical tailwinds that should benefit investors in the long-term, both in fixed income (higher current yields) and equities (better economic growth fundamentals). But the other two forces are definitely at play and deserve monitoring.
MARKET REVIEW
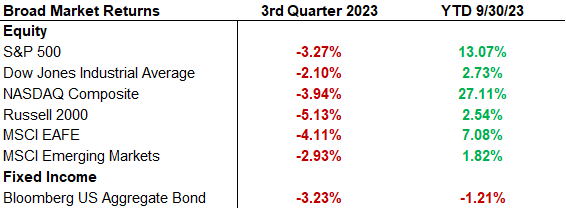
Stocks and bonds turned lower during the 3rd quarter, primarily in September with the S&P 500 falling -3.27% during the 3rd quarter but still is producing a strong year at +13.07% YTD through 9/30/23. The Dow Jones Industrial Average and the Russell 2000 (small-cap companies) continued to lag for the year, returning +2.73% and +2.54% YTD through 9/30/23.9
During the weakness of the 3rd quarter, Growth stocks finally bent under the pressure of rising rates while Value stocks outperformed on a relative basis. Growth stocks, specifically Large-cap Growth stocks, home of the so-called “Magnificent 7” stocks: Apple (AAPL), Microsoft (MSFT), Google parent Alphabet (GOOGL), Amazon.com (AMZN), Nvidia (NVDA), Meta Platforms (META) and Tesla (TSLA), continue be an outlying area of strength in an otherwise modestly positive market for the year through 9/30/23.10
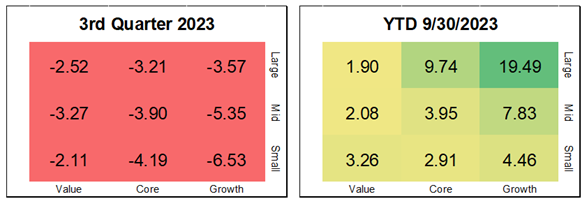
The market concentration remains extremely heavy in large-caps, where the top 10 companies now account for 31.9% of the S&P 500. The average stock in the S&P 500 has returned only +1.79% through 9/30/23 vs. +13.07% for the index demonstrating the strength of the largest weightings this year. 11
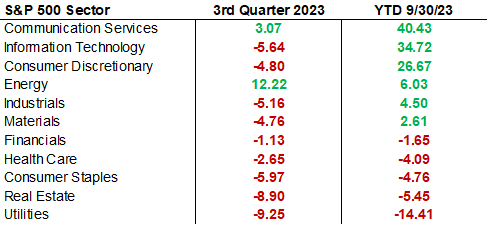
The sector dispersion tells this story equally well as 5 sectors have negative returns through 9/30/23 while 6 are positive (table below).12
The Communication Services, Information Technology and Consumer Discretionary sectors are experiencing strong rebounds buoyed by the favored Growth stocks for the year. Energy was a bright spot in the 3rd quarter boosted by rising commodity prices, but Value-heavy/higher dividend-yielding sectors Utilities, Real Estate, Consumer Staples, and Health Care are lagging on the year.13
International equities were down along with the US companies in the 3rd quarter but remain positive for the year through 9/30/23. MSCI EAFE (developed markets) was down -4.11% in the 3rd quarter and is up +7.08% for the year while MSCI EM (emerging markets) was down -2.93% in the 3rd quarter and up less +1.82% for the year.14
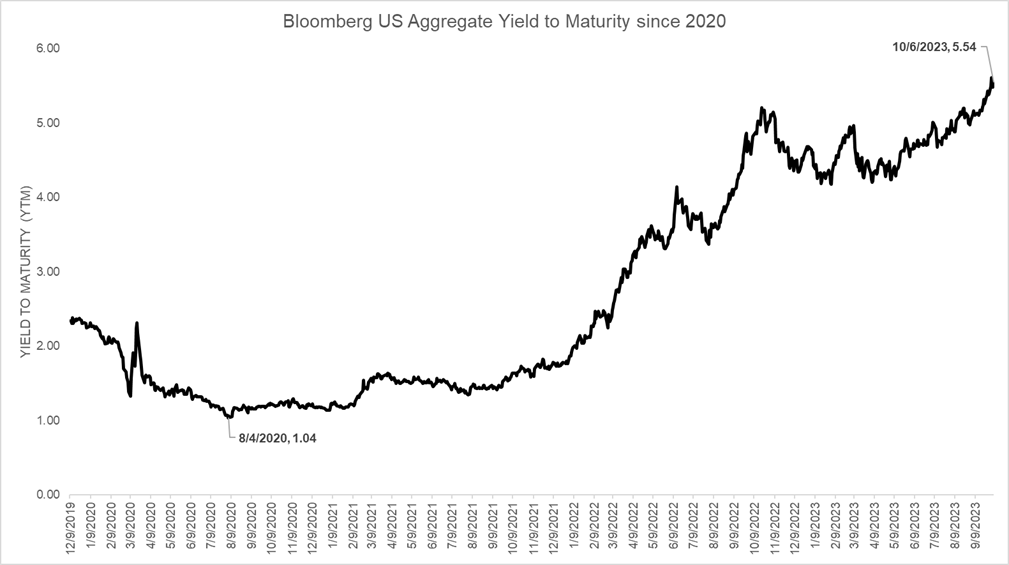
The broad bond market as represented by the Bloomberg US Aggregate Bond Index fell -3.23% during the 3rd quarter and is negative for the year, down -1.21% through 9/30/23. If this held, it would mark an unprecedented 3rd straight negative year for the Aggregate index after not even having two consecutive down years going back to 1976.15
The long-term silver lining to the pain in the bond market is the increasing current yield which historically correlates to forward return expectations making today’s fixed income environment as ripe for opportunity as investors have seen since pre-Global Financial Crisis. The yield-to-maturity (YTM) on the Aggregate index has increased from an all-time low of 1.04% in August of 2020 to over 5.5% as of 10/6/202316:
Elsewhere in Fixed Income, Investment Grade Corporates and Municipal bonds were also down during the 3rd quarter: -4.29% and -3.95% respectively and are down -0.44% and -1.38% YTD through 9/30/23.17
Below investment-grade credit remained a strong point this year vs Investment Grade issues — US High Yield was modestly positive during the 3rd quarter as credit spreads compressed overall and their relatively lower interest rate risk profile cushioned as rates rose. US High Yield is up +5.86% YTD through 9/30/23. 18
EARNINGS AND VALUATION
In the coming weeks, companies will report 3rd quarter results. This quarter is expected to be the last of a series of weak quarters of earnings growth, the market is forecasting a -0.4% earning decline vs. the 3rd quarter of 2022, which would be the 4th consecutive quarter of decline for the S&P 500.19
Looking forward, the market expects a return to growth in the 4th quarter of this year, 2024 and 2025 and this return to growth is what the market has moved its focus to. Analysts expect earnings growth of 9.3% in the 4th quarter 2023, 12% for 2024 and 12.1% for 2025, a strong rate of growth for coming years.
The S&P 500 trades a forward P/E (price-to-earnings) multiple of 18x, right above the average of 17.5x for the past 10 years – so the market is neither cheap nor expensive by this measure. But it’s important to highlight the top heaviness of S&P 500 valuations in a similar fashion to the concentration in performance. The S&P 500’s valuation is slightly elevated due to the weight of the largest names which also carry lofty valuations. The top 10 companies in the S&P 500 trade at a 28.6x P/E multiple while the remaining 490 trade at 15.1x.
Moving down in market-cap, valuations of small and mid-cap companies still trade at discounts to their large-cap counterparts.22 We view this environment as conducive to active management and diversification in asset allocation as we look for the market to broaden out performance wise going forward.
We appreciate the opportunity to provide these market updates on a quarterly basis, please reach out with any questions regarding the content or as it specifically pertains to your personal investments with Kavar Capital Partners.
John Nagle, CFA
Chief Investment Officer
Footnotes:
- Morningstar Direct Data
- Federal Reserve Bank of St. Louis FRED Economic Data https://fred.stlouisfed.org/series/T10YIE and https://fred.stlouisfed.org/series/T5YIE
- CME Growth FedWatch Tool https://www.cmegroup.com/markets/interest-rates/cme-fedwatch-tool.html
- Bloomberg Market Data
- Bloomberg https://www.bloomberg.com/news/articles/2022-10-17/forecast-for-us-recession-within-year-hits-100-in-blow-to-biden
- Atlanta Fed GDPNow Forecast as of 10/10/23 https://www.bloomberg.com/news/articles/2022-10-17/forecast-for-us-recession-within-year-hits-100-in-blow-to-biden
- Federal Reserve Bank of St. Louis FRED Economic Data https://fred.stlouisfed.org/series/PAYEMS
- Bloomberg Market Data
- Morningstar Direct Data
- Morningstar Direct Data
- Morningstar Direct Data
- Morningstar Direct Data
- Morningstar Direct Data
- Morningstar Direct Data
- Morningstar Direct Data
- Bloomberg Market Data
- Morningstar Direct Data
- Morningstar Direct Data
- Yardeni Research https://www.yardeni.com/pub/yriearningsforecast.pdf
- Yardeni Research https://www.yardeni.com/pub/yriearningsforecast.pdf
- FactSet Earnings Insight https://advantage.factset.com/hubfs/Website/Resources%20Section/Research%20Desk/Earnings%20Insight/EarningsInsight_100623A.pdf
- JPMorgan Guide to the Markets as of 10.10.23 https://am.jpmorgan.com/content/dam/jpm-am-aem/americas/us/en/insights/market-insights/guide-to-the-markets/daily/protected/mi-daily-gtm-us.pdf
The views expressed herein are those of John Nagle on October 11th, 2023 and are subject to change at any time based on market or other conditions, as are statements of financial market trends, which are based on current market conditions. This market commentary is a publication of Kavar Capital Partners (KCP) and is provided as a service to clients and friends of KCP solely for their own use and information. The information provided is for general informational purposes only and should not be considered an individualized recommendation of any particular security, strategy, or investment product, and should not be construed as investment, legal or tax advice. Different types of investments involve varying degrees of risk, and there can be no assurance that any specific investment or strategy will be suitable or profitable for a client’s investment portfolio. All investment strategies have the potential for profit or loss and past performance does not ensure future results. Asset allocation and diversification do not ensure or guarantee better performance and cannot eliminate the risk of investment losses. The charts and graphs presented do not represent the performance of KCP or any of its advisory clients. Historical performance results for investment indexes and/or categories, generally do not reflect the deduction of transaction and/or custodial charges or the deduction of an investment management fee, the incurrence of which would have the effect of decreasing historical performance results. There can be no assurances that a client’s portfolio will match or outperform any particular benchmark. KCP makes no warranties with regard to the information or results obtained by its use and disclaims any liability arising out of your use of, or reliance on, the information. The information is subject to change and, although based on information that KCP considers reliable, it is not guaranteed as to accuracy or completeness. This information may become outdated and KCP is not obligated to update any information or opinions contained herein. Articles herein may not necessarily reflect the investment position or the strategies of KCP. KCP is registered as an investment adviser and only transacts business in states where it is properly registered or is excluded or exempted from registration requirements. Registration as an investment adviser does not constitute an endorsement of the firm by securities regulators nor does it indicate that the adviser has attained a particular level of skill or ability.