
Market Update – February 5, 2018
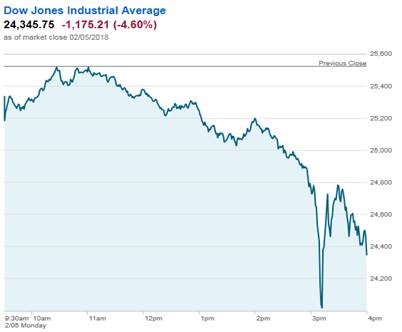
Today was a record-setting day in the US stock market, but a record we‘d rather not have set. The Dow Jones Industrial Average had its largest intra-day point decline of all time today, (going back to 1900), dropping almost 1,600 points before recovering a bit to end the day lower by 1,175 (see below from Charles Schwab, schwab.com).
As we offered yesterday, regarding the drop on Friday, here is additional perspective on the decline:
Despite being the worst intra-day drop in history, today was only the 108th worst percentage drop in the Dow. The last time the Dow had a drop of this magnitude (%-wise) was in August 2011 – & at that time, the index level was 10,700……today it closed at 24,345 – more than double the value.1
Including today, there have been 359 3% (or greater) 1-day declines in the Dow over the course of market history.2
Today’s point drop exceeded the value of the entire Dow in 1984.3
Suffice to say, we’ve come a long way. And we’ve certainly not followed a straight path to get here!
While we identified the culprit of Friday’s decline as the otherwise boring bond market, the same cannot be said of today.
In fact, bonds staged a pretty impressive rally this session. Perhaps yields crossed the line of demarcation between menacing and meaningful as demand pushed prices higher (& rates lower) throughout the day.
So if not the bonds and their embedded threat of inflation, where lies the blame for today’s decline?
While it is inconclusive, if you are watching the news tonight (CNBC has a special “Markets in Turmoil” segment on right now) you’ll hear mentions of a “flash crash”. A “flash crash” is a quick cascade of selling triggered by algorithmic trading programs that feed off of other algorithmic trading programs – elevating correlations and escalating the direction/momentum of those programs.
This certainly played a part in today’s decline. As did the realization that a new head of the Federal Reserve Bank was sworn in this morning. While Jerome Powell seems like a heck of a nice man who never dissented with outgoing chairwoman, Janet Yellen, he is not her. And what we know about her is that she very much underwrote stock market risk while she was chair. She did so by maintaining a perpetually “dovish” posture on interest rates (a.k.a. loved keeping them low!) and the market isn’t sure that Powell will be as committed.
And speaking of the outgoing chairwoman, you may have caught these comments of hers from a CBS Sunday interview:
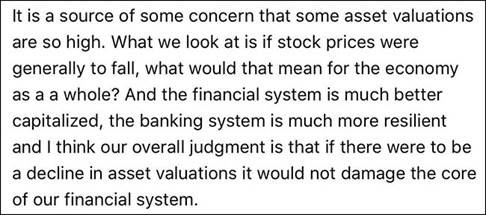
I don’t think that helped today……at all.
We can mention the Nunes memo as well. Or the pending (again!) government shutdown. Sure, both could conspire to erode the confidence attendant to optimism which can manifest itself in buying stocks, but geopolitics have much less of a lasting impact on markets than earnings and economic growth.
Thankfully, those have been pretty darn strong! Of note, regarding earnings:
To date, 50% of the companies in the S&P 500 have reported actual results for Q4 2017. In terms of earnings, more companies are reporting actual EPS above estimates (75%) compared to the five-year average. In aggregate, companies are reporting earnings that are 4.0% above the estimates, which is below the five-year average. In terms of sales, more companies (80%) are reporting actual sales above estimates compared to the five-year average. If 80% is the final number for the quarter, it will mark the highest percentage of S&P 500 companies reporting positive sales surprises since FactSet began tracking this metric in Q3 2008. In aggregate, companies are reporting sales that are 1.4% above estimates, which is also above the five-year average (Source:Factset)
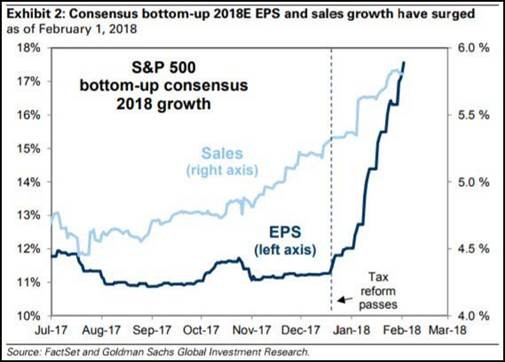
As well, from Goldman Sachs:
Also of note, regarding the economy:
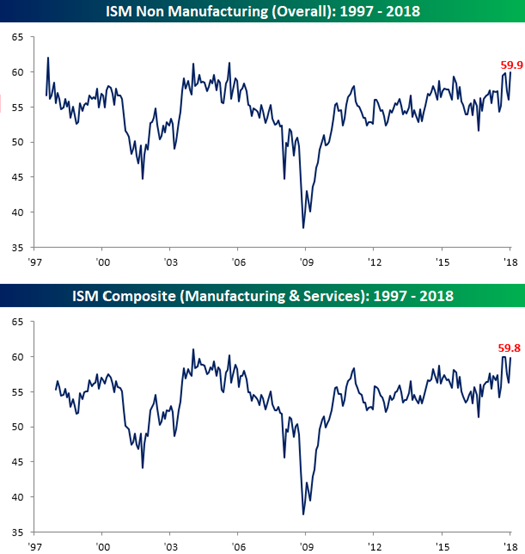
As shown in the top chart below, the ISM Services report for January surged to 59.9 from last month’s reading of 56.0. Not only was January’s 3.9 m/m increase the sixth largest since 1997 and the third largest of the current economic expansion, but at 59.9, the headline index has only been higher in three other months. On a combined basis and accounting for each sector’s share of the total economy, our January combined ISM came in at 59.8, which is also right near the highest levels of the current economic cycle.4
Much as it was difficult to predict the specific timing of the onset of this spate of volatility, so too is it evasive as to when it will conclude.
Our patience is buoyed by our optimism on the US & global economies and the strength of the companies operating therein.
Oh and also, we also have a very strong contrarian indicator working in our favor……this afternoon Gary Lezak tweeted about the drop in the stock market….For those of you not from KC, Gary is a weather man!
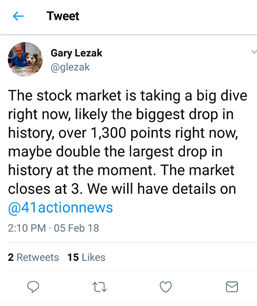
When the psyche of “Main Street” intersects with Wall Street, it tends to be a bullish indicator and I’d certainly say that this qualifies.
We’ll keep in touch.
1 http://thereformedbroker.com/2018/02/05/dow-drawdowns/
2 https://twitter.com/bespokeinvest/status/960612676903763973
4 https://www.bespokepremium.com/think-big-blog/ism-services-back-at-cycle-highs/
The views expressed herein are those of Doug Ciocca on February 5, 2018 and are subject to change at any time based on market or other conditions, as are statements of financial market trends, which are based on current market conditions. This information is provided as a service to clients and friends of Kavar Capital Partners, LLC solely for their own use and information. The information provided is for general informational purposes only and should not be considered an individualized recommendation of any particular security, strategy or investment product, and should not be construed as, investment, legal or tax advice. Past performance does not ensure future results. Kavar Capital Partners, LLC makes no warranties with regard to the information or results obtained by its use and disclaims any liability arising out of your use of, or reliance on, the information. The information is subject to change and, although based on information that Kavar Capital Partners, LLC considers reliable, it is not guaranteed as to accuracy or completeness. This information may become outdated and we are not obligated to update any information or opinions contained herein. Articles may not necessarily reflect the investment position or the strategies of our firm.