
Market Update – June 10th, 2022
After staging a decent bounce (roughly 7%) off of its bottom in late May, the S&P 500 (and the other primary US stock indices) are today threatening to revisit/retest those levels.
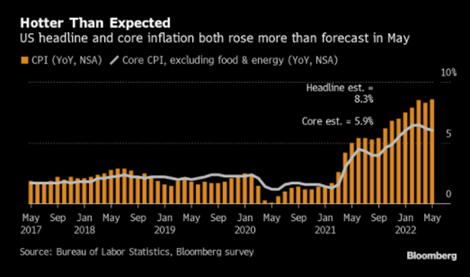
The prospect of passing the point of “peak inflation” was dispelled this morning as the year-over-year reading in CPI (Consumer Price Index) came in @ 8.6%. Month-over-month was higher by 1%. Shelter, food and gas were the largest contributors to both readings.1
The Federal Reserve Bank meets for 2 days next week and while it is certain that they will raise interest rates (most likely 0.50% based upon the Fed Funds Futures Market2) investors will be tuned into their communication on the future path (magnitude and duration) of hikes as they attempt to:
Raise the cost of capital -> To reduce aggregate demand -> That will cool inflationary pressures
The Fed faces significant challenges as their tools are limited to impacting the “demand” side of inflation. They are attempting to impair purchasing power which will limit the absorption of higher prices on the part of consumers. The term: “demand destruction,” is getting a lot of play lately. Better stated: “delicate demand destruction.” The key to their success is doing so in a fashion akin to a “controlled detonation,” as the impact of a wider contamination could cause the economy to not just slow, but to shrink. When the market reacts like it is today, it is exhibiting little confidence in the Fed’s success. And here is why…..
The Fed does not control the “supply” side of inflation. That is shaped by certain externalities. Notably, the energy and agricultural shortages emanating from armed conflict in Eastern Europe and the electronic component and manufacturing shortages emanating from the COVID lockdowns in China.
The absence of plentiful supply (in food, oil, semiconductors, etc.) puts upward pressure on prices. Adding the friction of higher capital costs to the equation intensifies the outcome and heightens investor fears that the Fed may be lifting rates into a cooling economy.
Those fears were also captured in another data point this am: the University of Michigan Sentiment Indicator. It came in @ 50.2. This is the lowest recorded level of this index since it came into existence in 1978.3 For reference, see below:
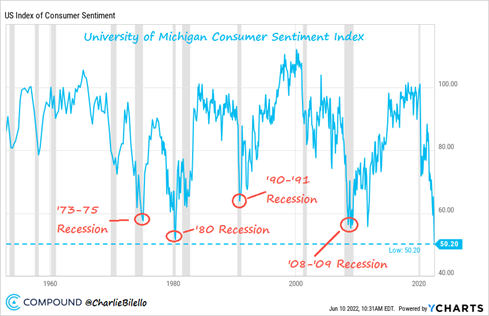
And while the circled trough points on the chart above all indicate the presence of the “R” Word, we are not convinced the economy is currently in recession nor that it imminently will be. More on that in a moment.
Regardless of where we are at in the economic cycle, the chart below, which highlights all the nadirs from the chart above, offers insight as to the performance of the S&P 500 once such inflection points have been hit:
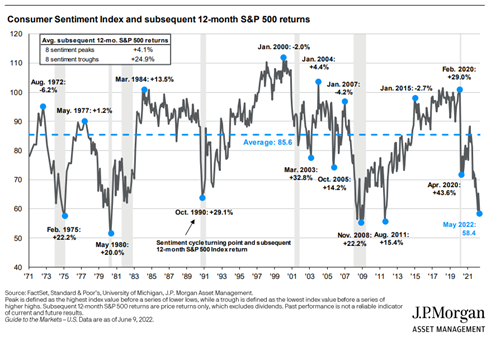
As indicated in the legend, the average gain 12 months after a trough point in sentiment in +24.9% in the S&P 500. All disclaimers acknowledged about prologues of the past, we nonetheless find this to be powerful.
As to whether we are headed into a recession, well we’re always technically headed into the next recession, it’s a normal part of the business cycle. The question is when, and the narrative has quickly shifted to sooner rather than later, even if the data shows otherwise. And while the prospects are this dire, there is always a temptation for a dyed-in-the-wool contrarian to point to things that portend a reversal in market fortunes. This is often the situation when the worst-case scenario that is baked into stock prices leads to an overcorrection of sorts.
Things like:
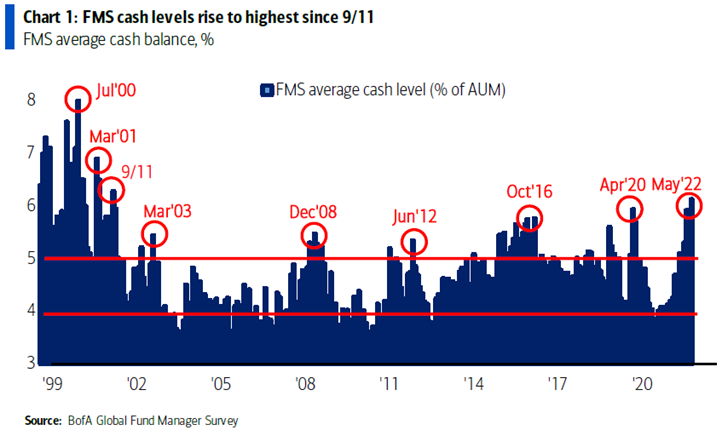
High investor cash balances:
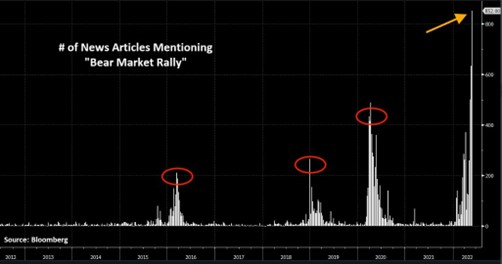
Or the financial press’ herd mentality:
But ultimately, there are 3 things that, in our opinion, support continued expansion (albeit slower expansion) of the economy for the near-term:
1. The strength of the job market – unemployment rate of 3.6%4
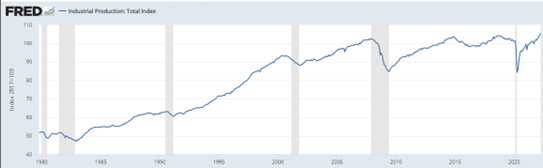
2. Strong industrial production (which tends to roll over ahead of an economic contraction):
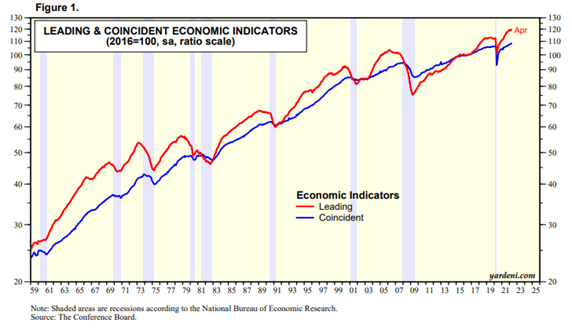
3. Leading Economic Indicators that are still peaking:
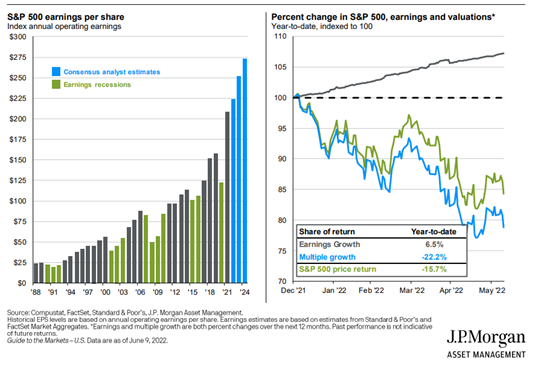
While the stock market has begun to heavily price in the prospects of a recession, valuations have compressed considerably since the first of the year.
As shown in the chart below, despite the expectation of ongoing earnings growth, the market’s multiple has dropped dramatically, offering interesting entry points for investors with time horizons appropriate for owning stocks
In volatile periods like we are in, it is paramount that you stick to your strategy – that which is consistent with your plan-based return objectives. Also, take the opportunity to rebalance portfolios – both within and across assets classes. And in the process, attempt to pick up quality @ prices that undeniably represent value, despite the patience that may be required for it to be reinforced.
Please reach out to me or anyone on our team regarding how this information and advice impacts your personal goals and portfolios.
Have a great weekend, dc
Footnotes:
- Bloomberg Market Data
- Bloomberg Market Data
- Bloomberg Market Data
- Federal Reserve Bank of St. Louis; https://fred.stlouisfed.org/series/UNRATE
The views expressed herein are those of Doug Ciocca on June 10, 2022 and are subject to change at any time based on market or other conditions, as are statements of financial market trends, which are based on current market conditions. This market commentary is a publication of Kavar Capital Partners (KCP) and is provided as a service to clients and friends of KCP solely for their own use and information. The information provided is for general informational purposes only and should not be considered an individualized recommendation of any particular security, strategy or investment product, and should not be construed as, investment, legal or tax advice. Different types of investments involve varying degrees of risk, and there can be no assurance that any specific investment or strategy will be suitable or profitable for a client’s investment portfolio. All investment strategies have the potential for profit or loss and past performance does not ensure future results. Asset allocation and diversification do not ensure or guarantee better performance and cannot eliminate the risk of investment losses. Charts and graphs presented do not represent the performance of KCP or any of its advisory clients. Historical performance results for investment indexes and/or categories, generally do not reflect the deduction of transaction and/or custodial charges or the deduction of an investment management fee, the incurrence of which would have the effect of decreasing historical performance results. There can be no assurances that a client’s portfolio will match or outperform any particular benchmark. KCP makes no warranties with regard to the information or results obtained by its use and disclaims any liability arising out of your use of, or reliance on, the information. The information is subject to change and, although based on information that KCP considers reliable, it is not guaranteed as to accuracy or completeness. This information may become outdated and KCP is not obligated to update any information or opinions contained herein. Articles herein may not necessarily reflect the investment position or the strategies of KCP. KCP is registered as an investment adviser and only transacts business in states where it is properly registered or is excluded or exempted from registration requirements. Registration as an investment adviser does not constitute an endorsement of the firm by securities regulators nor does it indicate that the adviser has attained a particular level of skill or ability.