Quarterly Investment Research Note – April 8th, 2024
1st Quarter 2024 Summary
- US large-cap stocks made new all-time highs for the first time in over two years and produced their best 1st quarter since 2019 with the S&P 500 finishing up +10.56%.1
- Although the high growth, Technology-focused stocks continued to garner considerable attention, participation was broad, with all sectors except for Real Estate producing positive returns. Notably strong quarters were posted in the Energy, Financial and Industrial sectors, supported by ongoing economic strength. The broadening of the rally intensified as the quarter progressed.
- Beyond the S&P 500, Small and Mid-cap stocks, along with International equities, also recorded gains. The Russell 2000 index concluded the quarter with a rise of +5.18%. MSCI EAFE and MSCI EM saw increases of +5.78% and +2.37%, respectively.2
- Treasury yields increased, leading to a decline of -0.78% in the Bloomberg US Aggregate Bond Index. This rise in yields was prompted by stronger-than-anticipated economic data and higher-than-expected inflation readings. These developments raised doubts about the Federal Reserve’s anticipated easing measures for 2024. The benchmark 10-year US Treasury yield ended the quarter at 4.20%, compared to 3.88% at the end of 2023.3
- The US economy added an impressive 829,000 jobs during the quarter and the unemployment rate remains at 3.8%.4 US Real GDP grew at +3.4% for the 4th quarter of 2023 and is forecast to have grown at +2.8% during the 1st quarter of 20245 reflecting robust and resilient consumer spending. Worries regarding a prospective recession driven by the Federal Reserve efforts to reduce inflation continued to diminish.
- Inflation continued its descent toward the Fed’s 2% target but in a sluggish manner, prompting the market to adjust its expectations for the number of rate cuts. Initially anticipated to be six at the start of the year, this number was revised downward to three. The Fed’s latest projections, released in March, also align with this expectation of three cuts.
1st Quarter 2024 Market Recap
During the first three months of the year, investors sustained the market’s momentum from 2023, fully embracing the “soft landing” scenario, wherein the economic expansion persists alongside declining inflation allowing the Fed to pivot to accommodative policy.
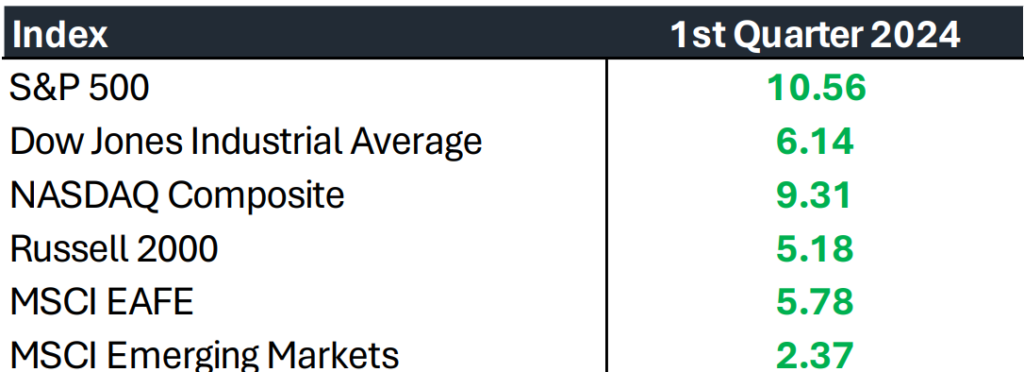
Economic indicators generally signaled steady growth across the broader economy, with certain sectors experiencing renewed acceleration. Bond yields drifted higher, causing a down quarter for the broad fixed income markets. The increase in yields reflected the flourishing optimism surrounding growth yet did not impede the upward trajectory of stock prices. Likewise, stock performance seemed largely unfazed by the adjustment in market pricing for expected rate cuts by the Federal Reserve. Throughout the quarter, market expectations for cuts in 2024 decreased from six to three, reflecting stubborn inflation and the ever-resilient labor market.6
Positive market returns were broad based throughout the quarter and unimpeded by any slight disruption — the S&P 500 went the entire quarter without even a -2% drop from the previous closing high. Market volatility has decreased and remained at low levels, bringing a sense of tranquility to the markets. The CBOE Volatility Index (VIX), a measure of market volatility often referred to as the “fear gauge,” averaged 13.7 for the quarter, a significant drop from its average of 25.6 in 2022 and 16.9 in 2023.7
While Growth stocks led Value stocks, the margin was modest compared to last year, as Energy, Financials and Industrials outperformed the market as sectors. Only Real Estate was negative for the quarter, as higher interest rates pressured the sector. The famed “Magnificent 7” stocks (* see definition below) saw some weakness with two members of the group (Apple and Tesla) finishing the quarter lower. Nvidia maintained its position as the frontrunner of the group, serving as the standard-bearer for the ongoing Artificial Intelligence revolution.8
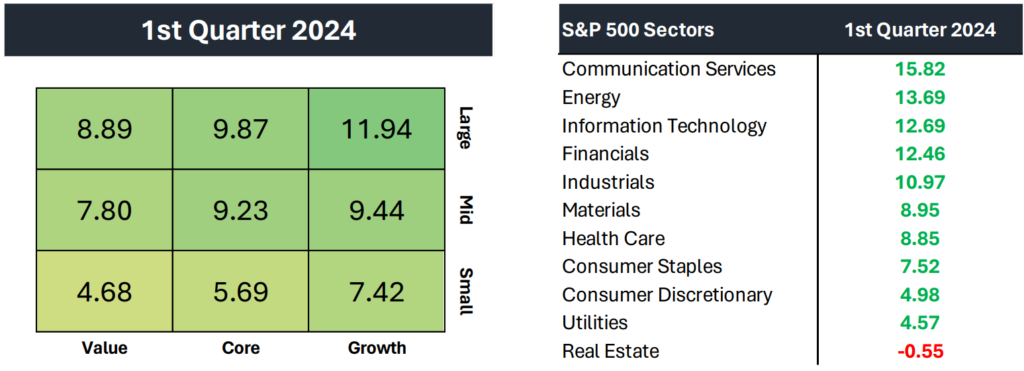
There has been a notable shift in the market landscape of late. In 2023, the market was undeniably dominated by a select few massive companies. However, in 2024, especially during the month of March, we’ve witnessed the other sectors, industries, and companies that constitute the market doing the heavy lifting. To illustrate this change, consider that in 2023, the “Magnificent 7” accounted for 60% of the S&P 500’s impressive 26.3% return. Yet, in 2024 thus far, their contribution has diminished, making up only 37% of the year-to-date return.9
In our view this is a major positive signal for the staying power of the current market strength, and the most important takeaway from the quarter. It isn’t feasible for extreme concentration and narrowness of performance in the market to persist, so it is necessary to see others participate – and they are.
Mid and Small-cap stocks also had a strong quarter with the Russell 2000 returning +5.18% for the three months. International stocks were positive in Developed and Emerging markets with Japan standing out from a country perspective. Japan’s Nikkei index hit a record high during the quarter for the first time since 1989.10 China equities continued to weigh down Emerging Markets. The expectation of central banks cutting interest rates is not exclusive to the US. Internationally, other central banks, notably the European Central Bank (ECB), are anticipated to initiate easing measures alongside the Federal Reserve in 2024, aiming to sustain economic expansion and bolstering asset prices.11
Rising rates in fixed income markets pushed bond prices down, causing the Bloomberg US Aggregate Bond Index to decline by -0.78% for the quarter. The benchmark 10-year US Treasury yield rose to 4.20% from 3.88% at the end of 2023. The short-end of the curve responded to the changing Federal Reserve policy expectations; the 2-year Treasury yield rose to 4.59% at the end of the quarter from 4.23% at the end of 2023.12
Credit spreads tightened throughout the quarter in response to the stronger than expected economic environment. The spread tightening allowed areas of credit to produce positive returns. The Bloomberg US High Yield Bond Index and the Credit Suisse Leveraged Loan Index returned +1.47% and +2.58% respectively for the quarter.13
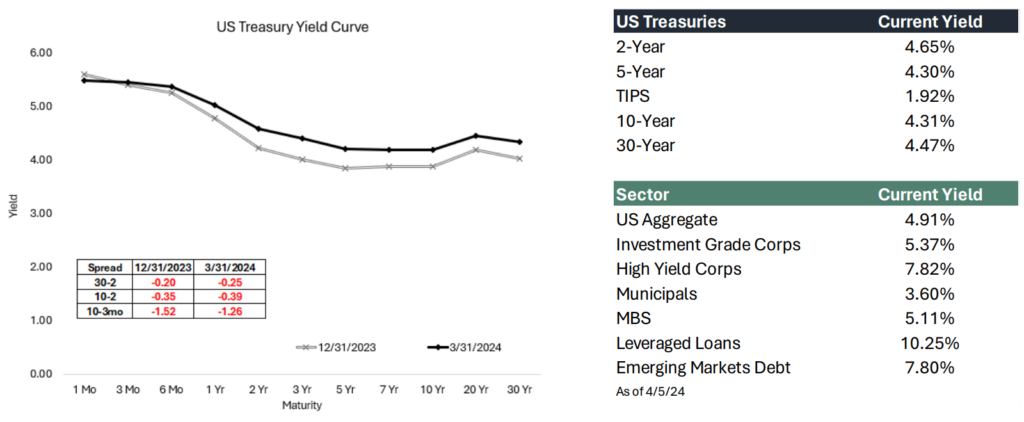
The yield curve remains inverted (long-term yields lower than short-term yields) and given a nearly parallel shift in the yield curve with similar increases across most maturities, the term premium was largely unchanged during the quarter. If, as the market anticipates, the Federal Reserve cuts interest rates in the near future, the curve could steepen – depending on the direction of long-term rates – and our team would view this as beneficial in terms of portfolio construction opportunities and for a more normal term structure of rates.
Outlook
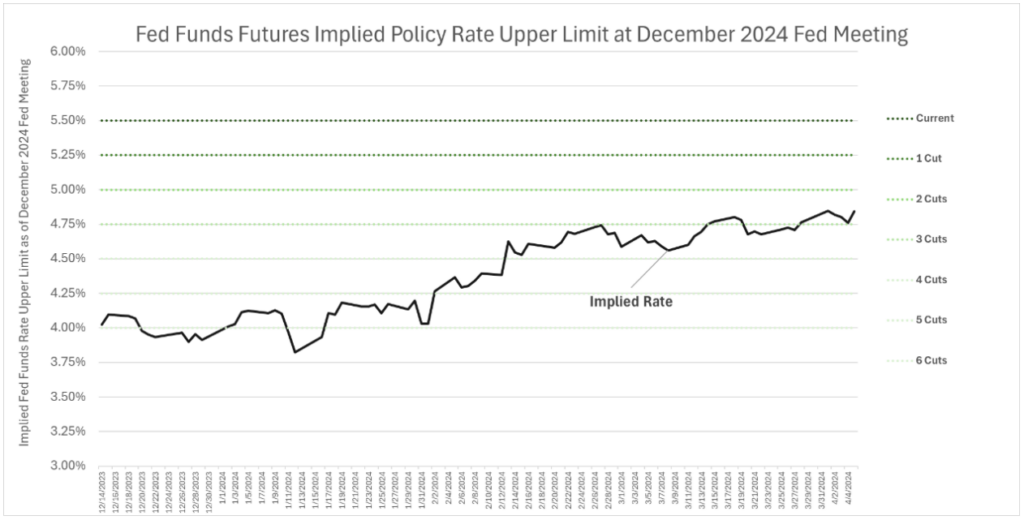
During the 2nd quarter, the Federal Reserve will be meet its first real test for whether it will pre-emptively cut interest rates while inflation, although moderating, is seemingly stuck above the committee’s 2% target. Thus far, Federal Reserve speakers have maintained their intent to be “data dependent” but have not walked back the idea of cuts during 2024. Fed Futures markets are currently calling the June meeting a coin-flip (51.2% chance of a rate cut). This will ultimately be answered as economic and inflation data filters in over the next few months.14
The graph below shows the implied policy rate based on the Fed Funds Futures Market at the December 18th, 2024 Fed Meeting. The rate has risen throughout the quarter as rate cut expectations have dramatically come in from six to start the year to barely pricing in 3 as of 4/8/24.15
We anticipate the Fed to continue to get positive data on the inflation front for a couple key reasons:
- Housing inflation continues to be the largest contributor to Core inflation over the recent months. As we have noted, housing inflation as calculated in measures like the Consumer Price Index (CPI) is flawed and lagged compared to real-time housing cost data. If you stripped housing out of the most recent CPI calculation, the year-over-year run rate for inflation is +1.7%. If you substituted CPI Shelter with a real-time index like the Zillow Observed Rent Index, it would be +2.4%. The lagged impact of shelter inflation shouldbe considered by the Federal Reserve committee voting members and should be helpful in pushing inflation closer to the 2% target over the course of 2024.16,17
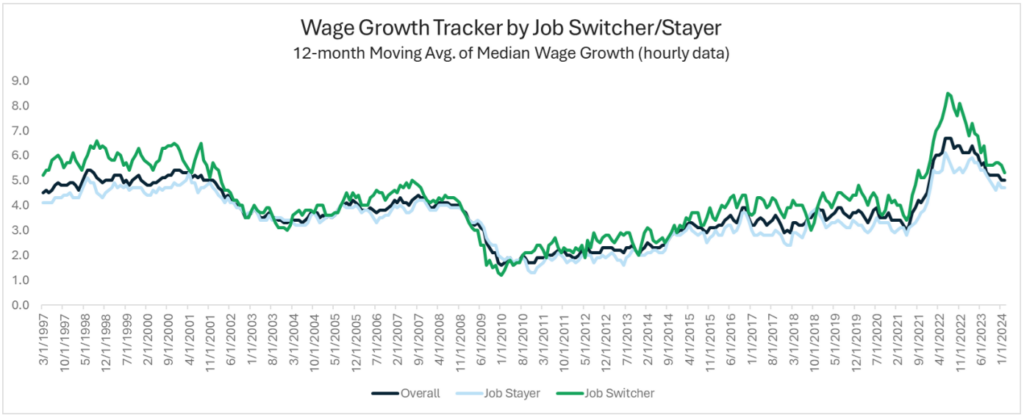
- The labor market has continued to stabilize, enabling a slowdown in wage growth. Wages are a key driver to services inflation for the Fed and are trending to levels associated with lower inflation. The Employment Cost Index (ECI), a quarterly measure of the cost of labor historically cited by the Fed, has declined from its peak of 5.6% in 2022 to 4.3% in the latest reading. The Federal Reserve Bank of Atlanta’s Wage Growth tracker shows substantial progress in moderating wage growth, particularly amongst “Job Switchers” pointing to a balancing of leverage between employer and employee.18,19
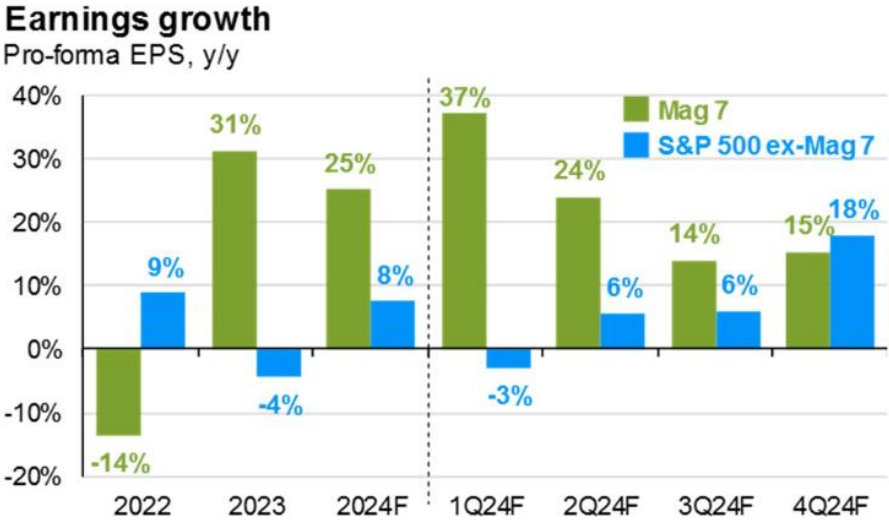
The earnings forecast has undeniably played a significant role in shaping stock performance over the past 18 months, as we have consistently highlighted in our communications during this period. It’s important to acknowledge that catalyzed by the optimistic earnings outlook, the market has surged by +28% since the lows on October 27th, 2023. And even with this positive remaining outlook, that the market may be slightly overvalued based on a price-to-forward earnings analysis. The forward P/E ratio stands at 20.7x, surpassing the 5-year average of 19.1x and the 10-year average of 17.7x.20
But importantly this is the index with extreme concentration at the top and the aforementioned broadening out of the market is extending to the earnings outlook, which instills optimism surrounding the fundamental picture. The earnings load is transitioning for the “Magnificent 7” to the other sectors, industries and companies that comprise the market.
Considering the current market dynamics, we maintain our focus on rebalancing efforts in portfolio management. This involves capitalizing on strength by selling and reallocating proceeds to diversify across sectors, styles, and geography.
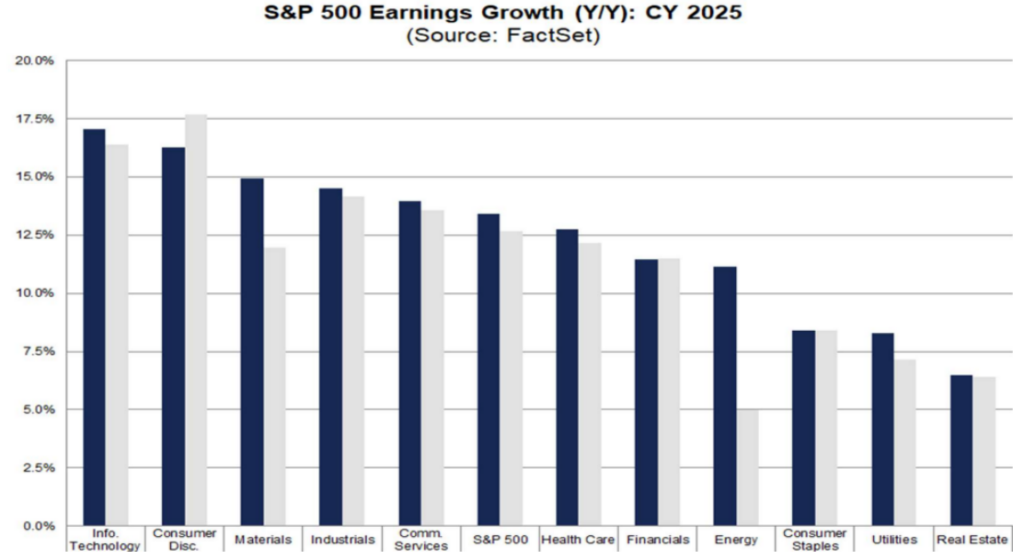
Overall, the market continues to expect earnings growth of 11% for 2024 and 13.4% during 2025. Technology continues to lead in earnings growth due to the epic capital expenditures happening in the realm of Artificial Intelligence. Across sectors, double-digit earnings growth in 2025 is also expected in the following areas: Consumer Discretionary, Materials, Industrials, Communication Services, Health Care, Financials and Energy.21
We will continue to stay in close contact with clients throughout the coming quarter as we expect eventful developments, particularly as it relates action from the Federal Reserve. We appreciate the opportunity to provide these market updates on a quarterly basis and please reach out with any questions regarding the content or as it specifically pertains to your personal investments with Kavar Capital Partners.
John Nagle, CFA
Chief Investment Officer
* The “Magnificent 7” is a basket of seven tech-focused large-cap stocks in the US that drew significant media attention during 2023: Alphabet ( GOOGL), Amazon (AMZN), Apple (AAPL), Meta Platforms (META), Microsoft (MSFT), Nvidia (NVDA) and Tesla (TSLA).
Footnotes:
- Morningstar Direct Data
- Morningstar Direct Data
- Morningstar Direct Data
- St. Louis Fed FRED Database
- Atlanta Fed GDP Now as of 4/5/24
- CME Group FedWatch https://www.cmegroup.com/markets/interest-rates/cme-fedwatch-tool.html
- St. Louis Fed FRED Database
- Morningstar Direct Data
- S&P Global https://www.spglobal.com/spdji/en/documents/commentary/market-attributes-us-equities-202403.pdf
- Morningstar Direct Data
- Morningstar Direct Data
- Morningstar Direct Data
- Morningstar Direct Data
- CME Group FedWatch https://www.cmegroup.com/markets/interest-rates/cme-fedwatch-tool.html
- CME Group FedWatch https://www.cmegroup.com/markets/interest-rates/cme-fedwatch-tool.html
- St. Louis Fed FRED Database
- Zillow Housing Data https://www.zillow.com/research/data/
- St. Louis Fed FRED Database
- Atlanta Fed Wage Growth Tracker
- FactSet Earnings Insight https://advantage.factset.com/hubfs/Website/Resources%20Section/Research%20Desk/Earnings%20Insight/EarningsInsight_032824.pdf
- FactSet Earnings Insight https://advantage.factset.com/hubfs/Website/Resources%20Section/Research%20Desk/Earnings%20Insight/EarningsInsight_032824.pdf
The views expressed herein are those of John Nagle on April 8th, 2024 and are subject to change at any time based on market or other conditions, as are statements of financial market trends, which are based on current market conditions. This market commentary is a publication of Kavar Capital Partners (KCP) and is provided as a service to clients and friends of KCP solely for their own use and information. The information provided is for general informational purposes only and should not be considered an individualized recommendation of any particular security, strategy or investment product, and should not be construed as investment, legal or tax advice. Different types of investments involve varying degrees of risk, and there can be no assurance that any specific investment or strategy will be suitable or profitable for a client’s investment portfolio. All investment strategies have the potential for profit or loss and past performance does not ensure future results. Asset allocation and diversification do not ensure or guarantee better performance and cannot eliminate the risk of investment losses. The charts and graphs presented do not represent the performance of KCP or any of its advisory clients. Historical performance results for investment indexes and/or categories, generally do not reflect the deduction of transaction and/or custodial charges or the deduction of an investment management fee, the incurrence of which would have the effect of decreasing historical performance results. There can be no assurances that a client’s portfolio will match or outperform any particular benchmark. KCP makes no warranties with regard to the information or results obtained by its use and disclaims any liability arising out of your use of, or reliance on, the information. The information is subject to change and, although based on information that KCP considers reliable, it is not guaranteed as to accuracy or completeness. This information may become outdated and KCP is not obligated to update any information or opinions contained herein. Articles herein may not necessarily reflect the investment position or the strategies of KCP. KCP is registered as an investment adviser and only transacts business in states where it is properly registered or is excluded or exempted from registration requirements. Registration as an investment adviser does not constitute an endorsement of the firm by securities regulators nor does it indicate that the adviser has attained a particular level of skill or ability.
