
Quarterly Investment Research Note – July 8th, 2022
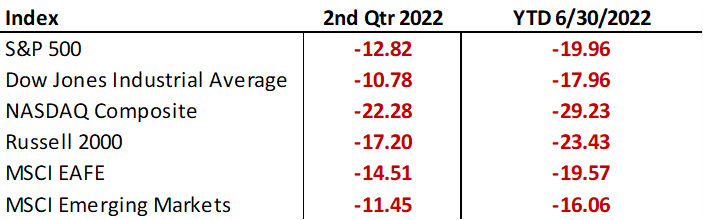
Markets continued to slump in the 2nd quarter under the pressure of inflation, tighter monetary policy and the pulling forward of recession expectations. On a total return basis, the S&P 500 dropped -19.96% in the first half of the year, the worst first half since 1970, wiping out 2021’s gains in the process. The -20% drop in the S&P 500 is the third such drop in less than 4 years (2018, 2020 and 2022)1, and while drawdowns are normal in equities, the volatility over the past few years is weighing heavily on investor confidence in conjunction with the shifting global economic landscape.
The incessant selling in the 2nd quarter for stocks, only briefly interrupted by short-term rallies, saw the S&P 500 go through a period where 10 out of 11 weeks were negative from April 9th to June 17th ending with consecutive weeks of worse than -5% losses. Additionally in the first half, the S&P 500 experienced 14 days where the index dropped by over -2%2.
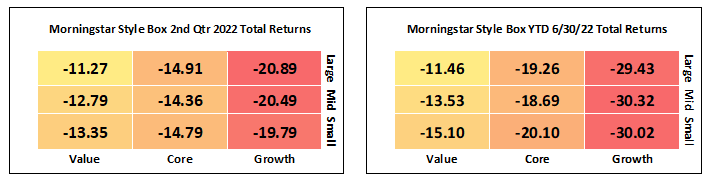
Both styles, Value and Growth, lost ground overall while Value outperformed, relatively, after being positive in the 1st quarter. For the 2nd Quarter, the Russell 3000 Value Index returned -12.4% while the Russell 3000 Growth Index returned -20.9%. Value stocks are positioned better to weather higher rates and higher inflation. Growth stocks have given up all of the outperformance generated during the pandemic.3
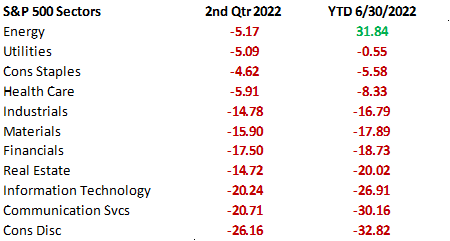
Amongst the S&P industry sectors, those that are exposed to commodity prices, like Energy, and those of a defensive nature, like Utilities, Consumer Staples and Healthcare are outperforming for 2022. Energy stocks dropped -17% in June as commodity prices plunged but are still the lone positive sector for the year, returning +31.84%. Technology, Communication Services and Consumer Discretionary stocks continue to lag the overall market as supply-chain issues linger.4
Small-cap stocks underperformed Large-cap during the 2nd quarter and thus far for the year as investors preferred the relative safety of larger companies vs. more economically sensitive smaller ones. The Russell 2000 Index fell -17.2% during the 2nd quarter and is down -23.4% for the year.5
International stocks outperformed US stocks over the 2nd quarter, both Developed and Emerging markets, despite a stronger US dollar. This is a welcome development for diversification geographically. Cheaper valuations (lower earnings and cash flow multiples) have helped equities abroad as they have here in the US.6
Fixed Income markets experienced further selling as interest rates continued to rise. The 2nd quarter followed the first quarter offering little diversification benefit of bonds vs. stocks. The Bloomberg US Aggregate Index dropped another -4.7% during the quarter and is down -10.4% for the year through 6/30/22. Credit, both investment grade and high yield, experienced pressure from rates as well as spread widening in the 2nd quarter. Investment Grade Corporates are down -16.2% for the year while High Yield Corporates are down -14.2%. As measured by the Bloomberg US Aggregate Index, the US bond market is experiencing its worst downturn since 1980.7
As we pass the mid-point of a historic year in the markets, we wanted to concisely summarize the investment landscape with 5 general areas to watch that we believe will drive performance in the 2nd half:
5 areas to watch:
- Earnings season
Throughout the year corporate earnings have remained extremely resilient. The 2nd quarter earning season, which is just underway, will give the answer to a looming question for investors as economic uncertainty has percolated: when/if this uncertainty will impact earnings? The weeks of July 25th and August 1st are particularly important to watch as many companies report. For all of 2022, analysts are expecting S&P 500 earnings to grow by 10% – that is the bogey for the market to hit as earnings come in over the next 2 quarters.8
So far, earnings expectations from Wall Street have not fallen along with investor sentiment. If the market is able to deliver on earnings this quarter and the remainder of the year, it will go a long way to restoring investor confidence in the fundamental story of stocks at cheaper valuations.
- Credit Spreads
Credit spreads in the Fixed Income markets have remained relatively calm given the amount of volatility in the equity and Treasury markets but began to widen as economic uncertainty increased and ended the quarter at their widest levels since July 2020.9
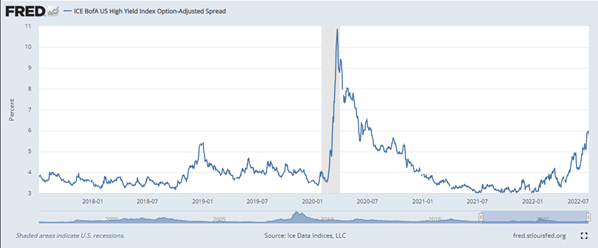
Credit spreads are an important indicator of credit risk perceived by the capital markets. Widening credit spreads are indicative of an increase in credit risk. Further widening would be an indication of economic distress for corporations and reduced appetite for risk in the markets.
- Volatility
While the CBOE Volatility Index, aka the VIX, never reached the much discussed 40 reading, the general elevated posture has added a layer of unwelcome anxiety over markets. The median of VIX closing values during 2022 is 27 compared to the long-term median closing level of 17.7.10
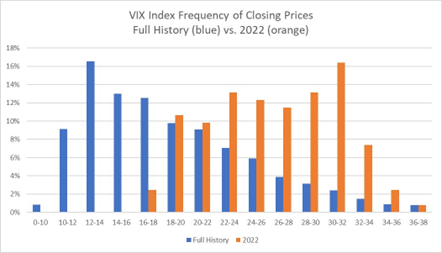
A drop in the VIX to more historically normal levels would alleviate stress in the market and signal a less defensive posture.
- Recession?
After the 1st quarter printed negative real GDP growth (-1.6%)11 the recession-callers got vocal – considering the rule-of-thumb that 2 consecutive quarters of negative GDP growth defines a recession. However, this is not the true definition of a recession. The official arbiter of recession dating, the NBER, defines a recession as: a significant decline in economic activity that is spread across the economy and that lasts more than a few months.12
Regardless of whether we technically have an imminent recession (or are currently in one) or not, many markets are pricing this as a foregone conclusion and a more severe downturn than is likely in our estimation.
The 2nd quarter GDP print will be watched closely given the rule-of-thumb definition. The Atlanta Fed’s GDP Now forecast is showing -1.9% for the quarter13, which if the quarter is negative will give credibility to the recession camp.
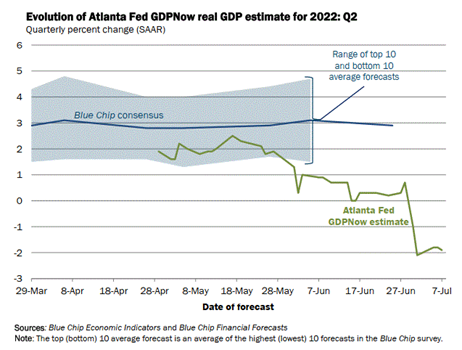
The advance read on 2nd quarter GDP comes out on July 28th and we expect this to be a market moving headline.
- Inflation and the Fed
We can’t end with this update before discussing inflation and the Fed in more depth. Inflation is the clear and obvious catalyst for the market movements during 2022. The Fed is determined to curb inflation even if it comes at a significant cost to economic growth. When inflation begins to cool due to tighter financial conditions and when it has evidenced a true cresting, it will go a long way to determining the direction of risk assets.
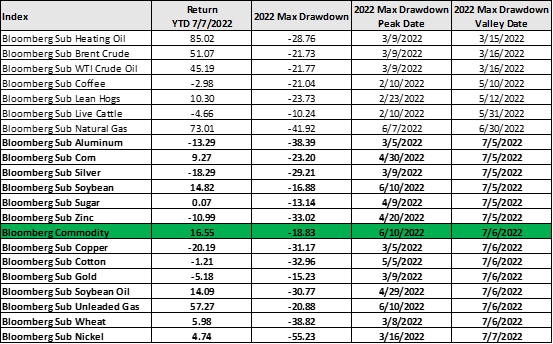
There is some hope that we will begin to see cooler inflation prints in the coming months. The first being the drop in commodity prices over the recent period. Perhaps most importantly for consumers and businesses, since June 9th, WTI Crude oil has dropped -18.6% and recently broke below $100/barrel – there should be relief coming to the gas pumps. Beyond oil, the broader commodity complex has also seen pullbacks as of late from agricultural (wheat for instance) to industrial metals (copper for instance) are in their largest drawdowns of the year14:
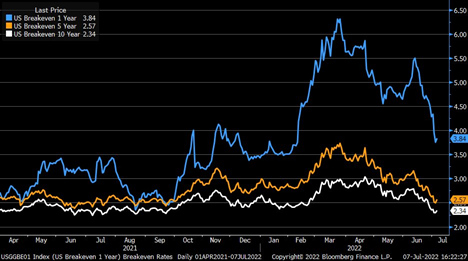
Market-based inflation expectations are also plummeting and signaling a top in inflation may be in15:
If the Fed recognizes these as signs their policies are working and supply-side issues are correcting it may give them an opportunity to ease up on their rate hike path.
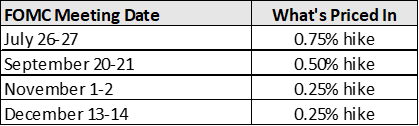
The Fed has 4 more policy setting meetings on the calendar for 2022 on the dates below (with the action that the market is currently pricing in16):
As far as inflation goes, there are 6 more Consumer Price Index (CPI) and Personal Consumption Expenditures (PCE) prints to come out this year – with the next CPI on July 13th and the next PCE on July 29th. These prints will help determine if the Fed’s actions are having their intended impact on inflation.
We’ll keep in close touch as we sift through the market and economic developments with a close eye on the 5 areas we mentioned above. Please reach out to our team with questions/comments on how the information presented in this update is impacting your portfolio specifically.
Footnotes:
- Morningstar Direct Data
- Morningstar Direct Data
- Morningstar Direct Data
- Morningstar Direct Data
- Morningstar Direct Data
- Morningstar Direct Data
- Morningstar Direct Data
- FactSet Earnings Insight https://www.factset.com/earningsinsight
- Ice Data Indices, LLC, ICE BofA US High Yield Index Option-Adjusted Spread [BAMLH0A0HYM2], retrieved from FRED, Federal Reserve Bank of St. Louis; https://fred.stlouisfed.org/series/BAMLH0A0HYM2, July 7, 2022.
- Chicago Board Options Exchange, CBOE Volatility Index: VIX [VIXCLS], retrieved from FRED, Federal Reserve Bank of St. Louis; https://fred.stlouisfed.org/series/VIXCLS, July 8, 2022.
- U.S. Bureau of Economic Analysis, Real Gross Domestic Product [GDPC1], retrieved from FRED, Federal Reserve Bank of St. Louis; https://fred.stlouisfed.org/series/GDPC1, July 7, 2022.
- National Bureau of Economic Research https://www.nber.org/business-cycle-dating-procedure-frequently-asked-questions#:~:text=A%3A%20The%20NBER’s%20traditional%20definition,more%20than%20a%20few%20months.
- Federal Reserve Bank of Atlanta https://www.atlantafed.org/cqer/research/gdpnow
- Morningstar Direct Data
- Bloomberg Market Data
- CME Group FedWatch Tool https://www.cmegroup.com/trading/interest-rates/countdown-to-fomc.html
The views expressed herein are those of John Nagle on July 8th, 2022 and are subject to change at any time based on market or other conditions, as are statements of financial market trends, which are based on current market conditions. This market commentary is a publication of Kavar Capital Partners (KCP) and is provided as a service to clients and friends of KCP solely for their own use and information. The information provided is for general informational purposes only and should not be considered an individualized recommendation of any particular security, strategy or investment product, and should not be construed as, investment, legal or tax advice. Different types of investments involve varying degrees of risk, and there can be no assurance that any specific investment or strategy will be suitable or profitable for a client’s investment portfolio. All investment strategies have the potential for profit or loss and past performance does not ensure future results. Asset allocation and diversification do not ensure or guarantee better performance and cannot eliminate the risk of investment losses. Charts and graphs presented do not represent the performance of KCP or any of its advisory clients. Historical performance results for investment indexes and/or categories, generally do not reflect the deduction of transaction and/or custodial charges or the deduction of an investment management fee, the incurrence of which would have the effect of decreasing historical performance results. There can be no assurances that a client’s portfolio will match or outperform any particular benchmark. KCP makes no warranties with regard to the information or results obtained by its use and disclaims any liability arising out of your use of, or reliance on, the information. The information is subject to change and, although based on information that KCP considers reliable, it is not guaranteed as to accuracy or completeness. This information may become outdated and KCP is not obligated to update any information or opinions contained herein. Articles herein may not necessarily reflect the investment position or the strategies of KCP. KCP is registered as an investment adviser and only transacts business in states where it is properly registered or is excluded or exempted from registration requirements. Registration as an investment adviser does not constitute an endorsement of the firm by securities regulators nor does it indicate that the adviser has attained a particular level of skill or ability.