
Investment Research Note – April 9, 2018
Review:
The first three months of 2018 are in the books and the S&P 500 finished in the red for a calendar quarter for the first time since the third quarter of 2015.1 After roaring out of the gate in January, a myriad of issues conspired to push global stocks into correction territory from their peaks. The return of volatility was the overarching theme thus far in 2018, fueled by daily doses of haphazard headlines. Whether it was tariffs and trade wars, data-security issues for Facebook or Amazon’s use of the postal service it was a seemingly never-ending stream of captions and titles undercutting any market support. The confluence of factors was more than enough for investors to re-rate the risks and valuation levels in the equity markets.
Equities:
US Large Cap Stocks closed the quarter down -0.76% on a total return basis while US Small Caps were slightly better off finishing down -0.08%. Developed International stocks were down -1.53% while Emerging Markets stocks were a relative bright spot finishing up +1.42%2
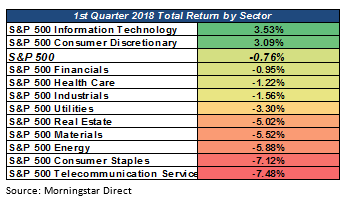
Domestically, Growth stocks continued to outperform Value stocks. The Information Technology and Consumer Discretionary sectors were the only two positive sectors in the S&P 500, finishing up +3.53% and +3.09% respectively for the quarter. Traditional Value sectors like Telecom, Consumer Staples, Real Estate and Utilities all contributed to the underperformance vs. the Growth style. In general, stocks paying high dividend yields struggled as bond yields offered an attractive alternative income stream. Telecom and Staples were the worst performing S&P 500 sectors for the quarter, down -7.48% and -7.12% respectively. Financials felt the benefit of rising rates and steepening yield curve but still finished down -0.95%.3

Source: Morningstar Direct
Emerging Market stocks led Developed market stocks in a continuation of 2017 for the quarter. The commodity rebound continued to be a strong tailwind for resource intensive Emerging economies like those in Russia and Brazil. In Developed countries, Japan ended as an outperformer, finishing up +1.06% for the quarter while Developed Europe saw mixed performance as the markets in their largest economies, Germany and UK, lagged the broader indices.4
Fixed Income:
As bond yields rose, Fixed Income lagged. The Bloomberg Barclays US Aggregate Bond index finished down -1.46%.5 The bright spots for Fixed Income were in the sectors exhibiting low or no duration (interest rate risk). Global bonds, particularly Emerging Market issues performed well with the tailwind of a falling US Dollar. Floating rate issues whose coupon payments are tied to a reference rate, like LIBOR, ended the quarter in positive territory as well. Credit conditions remained strong, as spreads widened just barely even in the midst of stock market volatility.6
The 10-year US Treasury yield moved from 2.40% at the end of 2017 to a 2018 high of 2.94% on February 21st.7 The move up in yields was most likely caused by anticipation of the Federal Reserve hiking the Fed Funds rate in March, economic optimism and heightened expectations of inflation finally emerging in the economy. Regardless of the cause, its effect on equity markets was a negative.
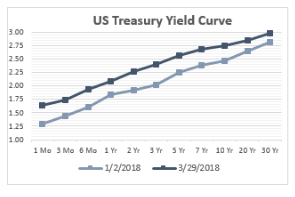
Source: US Treasury
Volatility:
When the CBOE Volatility Index (the VIX) spiked from opening at 13.64 on Friday February 2nd to a high of 50.30 on the following Tuesday, the crowded “short volatility” trade basically blew up and the unwinding of several derivative strategies designed around this trade caused concern over contagion. The damage was generally contained to holders of a few mismanaged strategies, but undoubtedly an environment of higher volatility trading has emerged.8
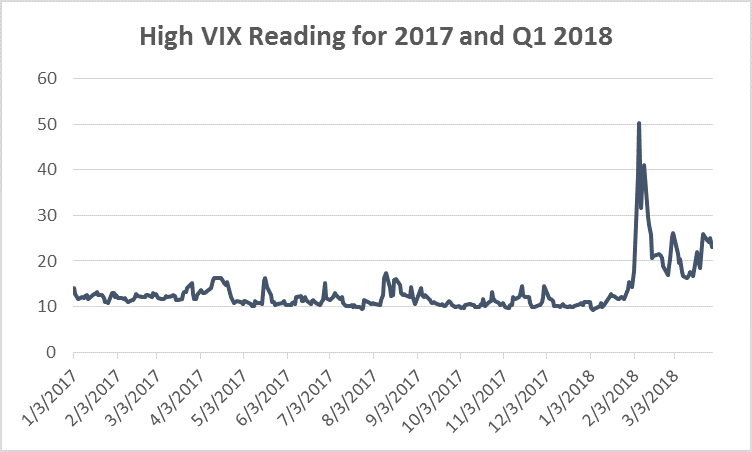
Source: CBOE
The S&P 500 had 23 days this quarter with a 1% or greater price move in either direction – the historical average for any quarter, going back to 1958, is 13 such sessions according to DataTek Research. To put into more recent perspective, in all of 2017 we only saw eight days with a 1% or more price move in either direction.9 Last year was literally the 2nd best year for risk-adjusted returns going back to at least 1942.10 2017 was the outlier calendar year in terms of market swings because there weren’t any. Investors should keep in mind that despite average drawdowns of nearly 14% each calendar year, annual returns are positive in 29 of 38 years for the S&P 500.11
Outlook:
Looking out over the rest of 2018 it’s clear that risk is elevated for stocks and it’s probably true that investor’s optimism and valuation multiple expansion went too far, too fast in January. The good news is that earnings season is coming up and a strong showing from profits and forward guidance can go a long way to modify the tone of the headlines driving the market of late. A return to thinking about the strong fundamentals in the economy and in corporate financials would be a welcome change.
Earnings:
Expectations for earnings season are for the highest year-over-year growth in Operating Earnings for the S&P 500 since the third quarter of 2011. S&P 500 Operating Earnings and As- Reported Earnings are expected to show year-over-year growth of 18.2% and 16.2% respectively for the quarter. While this is assisted by lower tax rates, the Street is also expecting Sales to grow at a 7% clip, year-over-year, for the quarter. This is astounding growth regardless of tax policy. The Technology Sector is expected to continue to lead, boasting an estimated growth rate of 35.2%, only bested by the Energy sector’s rate as it continues to recover from the crash in commodity prices during 2015-16.12

Valuations:
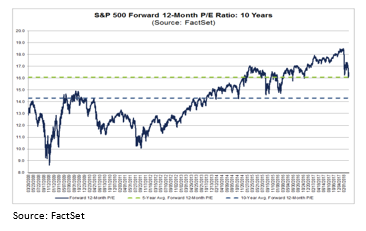
The numerator (Price) has moved down and the denominator (Earnings) is moving up for the S&P 500’s P/E ratio; or in other words: investors are paying less today for more earnings than they were at the beginning of the year. Valuations compared to long-term historical average were expensive but at this point it’s hard to make that statement. They’re likely closer to fairly valued for the market as a whole. The Forward 12-Month P/E Ratio has declined to 16.1x as of the end of the first quarter, down from 18.3x in December 2017.13
– John Nagle, CFA
Footnotes:
- Morningstar Direct data
- Morningstar Direct data
US Large Cap Stocks measured by total return of S&P 500 Index
US Small Cap Stocks measured by total return of Russell 2000 Index
Developed International Stocks measured by total return of MSCI EAFE Index
Emerging International Stocks measured by total return of MSCI Emerging Markets Index
- Morningstar Direct data, Standard & Poor’s
Growth and Value Styles measured by Russell Style Indices
Sectors are S&P 500 Index Sectors, classified by GICS
- Morningstar Direct data
Country returns measured by MSCI Indices
- Morningstar Direct data
- Louis Federal Reserve Economic Database
- US Treasury https://www.treasury.gov/resource-center/data-chart-center/interest rates/Pages/TextView.aspx?data=yield
- CBOE http://www.cboe.com/products/vix-index-volatility/vix-options-and-futures/vix-index/vix-historical-data
- MarktWatch https://www.marketwatch.com/story/the-dow-and-sp-500-have-already-doubled-the-number-of-1-moves-seen-in-all-of-2017-2018-03-26
- Morningstar Direct Data
- JP Morgan Guide to the Markets https://am.jpmorgan.com/blob-gim/1383407651970/83456/MI-GTM_2Q18.pdf?segment=AMERICAS_US_ADV&locale=en_US
- S&P Dow Jones Indices, Capital IQ estimates https://us.spindices.com/indices/equity/sp-500
- FactSet Earnings Insight as of 4/6/18 https://insight.factset.com/hubfs/Resources%20Section/Research%20Desk/Earnings%20Insight/EarningsInsight_040618.pdf
The views expressed herein are those of John Nagle on April 9, 2018 and are subject to change at any time based on market or other conditions, as are statements of financial market trends, which are based on current market conditions. This information is provided as a service to clients and friends of Kavar Capital Partners, LLC solely for their own use and information. The information provided is for general informational purposes only and should not be considered an individualized recommendation of any particular security, strategy or investment product, and should not be construed as, investment, legal or tax advice. Past performance does not ensure future results. Kavar Capital Partners, LLC makes no warranties with regard to the information or results obtained by its use and disclaims any liability arising out of your use of, or reliance on, the information. The information is subject to change and, although based on information that Kavar Capital Partners, LLC considers reliable, it is not guaranteed as to accuracy or completeness. This information may become outdated and we are not obligated to update any information or opinions contained herein. Articles may not necessarily reflect the investment position or the strategies of our firm.