
Investment Research Note – July 20, 2018
Review:
US stocks grinded out a modest gain amidst choppy trading for the 2nd quarter of the year. Volatility settled down from 1st quarter levels as investors pushed and pulled throughout the spring trying to find direction. The concerns around trade policy were omnipresent as the US and its trade partners lobbed tariffs (and threats of more tariffs) at each other in an unsettling fashion. While corporate earnings reports were a home run, guidance for the near future was less robust, prompting investors to ask: have we hit the peak in earnings growth for this cycle? The Fed, with newly appointed FOMC Chairman Jerome Powell initiating the first two rate hikes of his tenure in March and June, remains a catalyst for caution as markets ponder their tightening policy path – and flattening yield curve – closely. The uncertainty around these questions persist as we start the second half of the year.
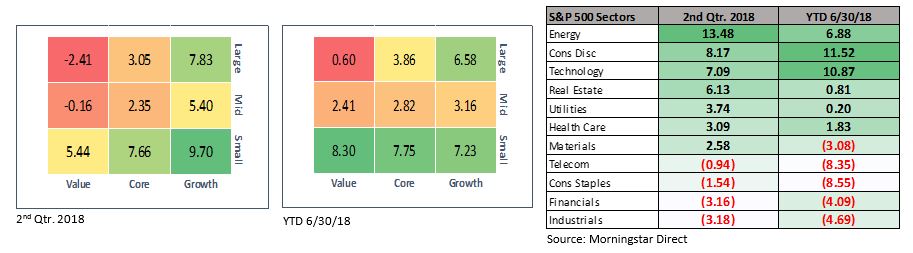
Equities: US Small Cap stocks represented a bright spot for equities in the 2nd quarter, the Russell 2000 Index posted a total return of +7.8%. Small Cap stocks are impacted positively by tax reform and generally have more US-based revenue streams that are reasonably well-insulated from trade tensions. US Large Cap stocks, as measured by the S&P 500, returned 3.4% after posting their first down quarter since 2015 to start the year. 1
Also in the US (see chart above). They trailed only the Energy sector which posted a +13.5% quarter on the tailwind of rising commodity prices. Value sectors: Consumer Staples and Telecom stabilized after a miserable first quarter, but still fell -1.5% and -0.9% respectively for the quarter and remain the laggards for the year.2
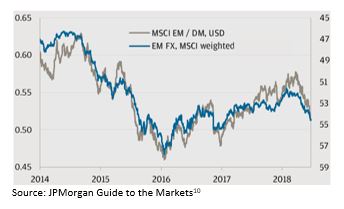
While the US markets were generally quiet during the quarter, global markets were not. Emerging Markets (EM) fell precipitously, ending the quarter down -8%. Argentina, Turkey, and Brazil all took turns introducing geopolitical and monetary policy concerns to the market while a rising US Dollar led the broader EM indices down. Developed Markets performed somewhat better but still trailed Domestic stocks, finishing down -1.2%.3
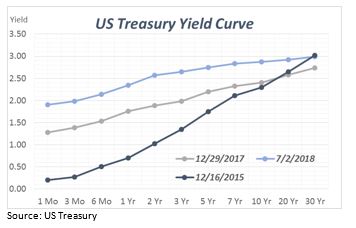
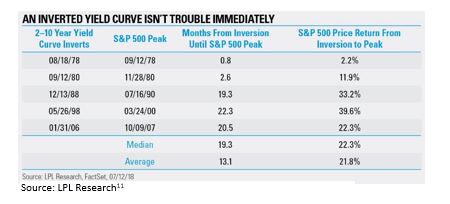
Fixed Income: The flattening and potential inversion of the yield curve has dominated conversation in Fixed Income markets this year. The short-end has moved up in lockstep with the Fed’s tightening path while the long-end has not responded in kind. The 10-year US Treasury yield moved from 2.40% at the end of 2017 to a 2018 high of 3.11% on May 17th (see graph). This was the first time for the 10-year trading above 3% since the end of 2013. 10-year rates however drifted lower towards the end of the quarter to 2.85%.4 The flattening yield curve has been a major cause of consternation for investors – fixed income and equity alike – as it has correlated positively with the prospects for a recession in the past. The data does indicate that recessions tend to follow inversion, though they don’t happen simultaneously. In fact, the median time from inversion to recession is 19 months and historically stocks perform positively in this window. 5 Also, investors should consider the enormous pressure that monetary policy has put on yields for nearly a decade and it is just now reverting to a more normal environment. Perhaps then, the yield curve is not as good of an indicator as it has been in the past.
The broad Bloomberg Barclays US Aggregate Bond Index was down -0.16% for the quarter and is down -1.62% for the year. This index has only experienced three negative calendar years since 1986, with the last being in 2013. On the positive side, Floating rate bonds continued to outperform in the US, finishing up 0.80% for the quarter, setting the pace for Fixed Income sectors. US High Yield rebounded from a poor first quarter and was up +1.0%, pushing to positive territory for the year.6
Earnings: Expectations for earnings growth for the 1st quarter were for the highest (year-over-year Operating Profits) for the S&P 500 since the third quarter of 2011. And companies delivered even better numbers than anticipated: in the first quarter S&P 500 companies posted 19.8% growth in operating earnings.7 Yet despite that strength, many companies received less than warm market receptions…..selling off instead of ascending. This led many to ask if the “top is in” for profit growth, indicating that maybe such strength was already “priced in”. That’s a plausible assertion. However, if stocks continue to grow revenues and earnings like they are this year, with little movement overall in the market, it would broadly improve valuations and may enhance expected returns. Earnings season is heating up for the 2nd quarter with the bulk of companies reporting in the last two weeks of July. Estimates currently sit at 21.1% growth in Operating Profits for the quarter. And it’s not expected to slow down – with estimates for 3rd and 4th quarter sitting at 26.1% and 26.8% year-over-year respectively.8
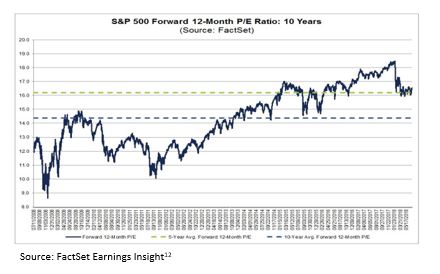
Valuations:
The forward P/E ratio sits near 16x for the S&P 500 – right on the average for the past five years. A sideways market with rising earnings can go a long way towards turning an expensive market into a fairly valued one. 9
– John Nagle, CFA
- Morningstar Direct Data
- Morningstar Direct Data
- Morningstar Direct Data
- US Treasury (https://www.treasury.gov/resource-center/data-chart-center/interest-rates/Pages/TextView.aspx?data=yield)5.
- LPL Research (https://lplresearch.com/2018/07/17/what-does-an-inverted-yield-curve-mean-part-deux/)
- Morningstar Direct Data
- FactSet Earnings Insight (https://www.factset.com/earningsinsight)
- S&P Dow Jones Indices (https://us.spindices.com/indices/equity/sp-500)
- FactSet Earnings Insight (https://www.factset.com/earningsinsight)
- JPMorgan Guide to the Markets (https://am.jpmorgan.com/us/en/asset-management/gim/adv/insights/guide-to-the-markets)
- LPL Research (https://lplresearch.com/2018/07/17/what-does-an-inverted-yield-curve-mean-part-deux/)
- FactSet Earnings Insight (https://www.factset.com/earningsinsight)
The views expressed herein are those of John Nagle on July 20, 2018 and are subject to change at any time based on market or other conditions, as are statements of financial market trends, which are based on current market conditions. This information is provided as a service to clients and friends of Kavar Capital Partners, LLC solely for their own use and information. The information provided is for general informational purposes only and should not be considered an individualized recommendation of any particular security, strategy or investment product, and should not be construed as, investment, legal or tax advice. Past performance does not ensure future results. Kavar Capital Partners, LLC makes no warranties with regard to the information or results obtained by its use and disclaims any liability arising out of your use of, or reliance on, the information. The information is subject to change and, although based on information that Kavar Capital Partners, LLC considers reliable, it is not guaranteed as to accuracy or completeness. This information may become outdated and we are not obligated to update any information or opinions contained herein. Articles may not necessarily reflect the investment position or the strategies of our firm.