
Market Update – October 11, 2018
Over the last 5 trading days, the stock market has been defined by negative sentiment and strong selling pressure. The last 2 days especially.
Since last Wednesday, the 3 primary US indices have posted the following returns1:
Dow Jones Industrial Average: -6.61%
Nasdaq Composite Index: -8.67%
S&P 500 Index: -6.73%
While their international counterparts have fared equally poorly:
MSCI EAFE (Europe, Asia, Far East): -5.42%
MSCI Emerging Markets Index: -7.76%
While I’ll offer some insights as to the attribution, it would be incorrect to characterize this occurrence as altogether uncommon. Consider the table below:
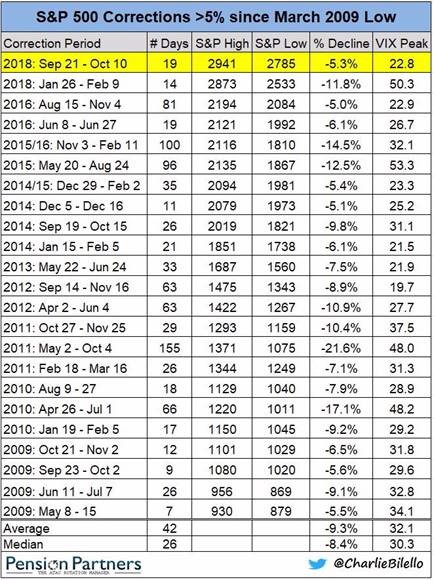
Since bottoming in March of ’09, the S&P 500 has experienced 23 pull-backs of greater than 5% (this chart/table created yesterday from Pension Partners). The current (highlighted and measuring the near-term high level of the index from 9/21 ) is unremarkable in its breadth and depth thus far, tho it is premature to consider it concluded.
The message, however, is that in spite of the media’s magnification of the blame-game (tune into CNBC tonight for fear-mongering at its finest….thanks Carl!), periodically, markets take a breather and the process of doing so is nothing if not normal.
Ok, onto some attribution analysis.
There are 2.5 theories that are puncturing the psychology of the investor, instigating volatility and motivating the market to mope.
Theory 1. Higher interest rates increase the cost of taking risk.
The Federal Reserve Bank’s Open Market Committee has raised interest rates 3 times so far in 2018 and 8 times since December of 2015. Each successive hike incrementally and adversely impacts the free cash flow of any borrower (citizen or corporation) that has debt tied to an adjustable reference rate. Higher debt payments leave less cash for consumption, investment or savings, invariably stunting those ingredients of growth.
Jerome Powell, head of the Fed, feels that this is a sound strategy for a percolating US economy that, left unattended, could easily overheat and instigate some serious inflation.
President Trump thinks Jerome Powell is, in his words: “loco.”
Absent a thorough psychological work-up, its not fair to comment on Powell’s state of sanity. What it is fair to comment on is the inverse relationship between bond interest rates and prices. It is axiomatic. Since the Fed has raised rates, the prices of bonds has gone down.
Typically, given their historical properties of negative correlation, when stocks go down, bonds go up, offering a benefit to balance within an investment portfolio. However, this most recent spate of market flux has offered no true ports in the storm. As an example, for 2018, the bond market (as measured by the Barclay’s Aggregate Index) has fallen 2.23%.1
With both stocks and bonds falling in value, investors have had their angst exacerbated and sought safety thru selling.
Quick comment on President Trump’s perspective: he would like to leave rates low…..because cheap money, when expressed into the economy, kicks up consumption and investment and elevates employment. Chairman Powell is aware of this connection. He is just concerned, really not crazy, about the impacts of overindulgence on the economy.
Theory 1.5. Trade wars and tariffs are increasing the throughput costs for companies and reducing their profit margins…..calling into question their valuations and prices.
President Trump and his economic team have been very busy renegotiating legacy trade agreements with many of our foreign counterparts.
Notably, a new NAFTA has been struck (different acronym) and optimism exists re: progress in talks with some member countries of the European Union.
But the market has been fixated on the stalemate in the US chats with China. That’s because, @ 15.4%, China is our largest trading partner. (click the link below for the full breakdown of US trade allocation by country).
https://www.census.gov/foreign-trade/statistics/highlights/toppartners.html
Both countries have imposed tariffs on certain products that cross the other’s borders in a veritable game of “chicken” , “uncle” or “mercy” but the only ones yelling are companies whose costs are difficult to contain in the absence of a replacement provider of parts/accessories/etc.
These challenges became evident recently when a few large US industrial companies, who rely on reasonably priced products from China, have had to pay-up to satisfy demand, but did so @ a peril to their profit margins.
This impact went, as the kids say: viral, as investors rushed to recalibrate the valuations of certain, similar stocks and proportionately took down their prices.
At this point it is hard to know which of the aforementioned attribution theories holds water – but I suspect it is a combination. Markets behave erratically with regularity, but in the midst of such, it feels unfamiliar.
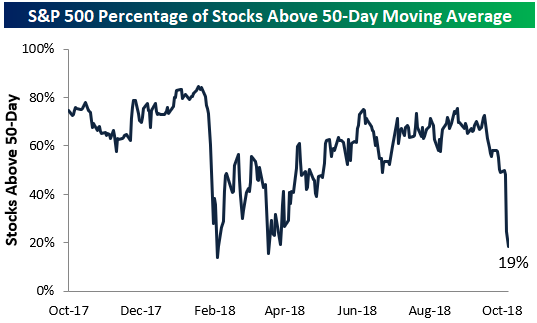
I’ll leave you with the charts below from Bespoke. In essence, they demonstrate that the market is in what is known as an “oversold” condition.
As they explain/project2: “The rate of selling we’ve seen over the last week, however, cannot be sustained. The S&P 500 ticked to 3.77 standard deviations below its 50-day moving average in afternoon trading, which is essentially “off the charts” to the downside. As shown below, five of eleven sectors are at similar oversold levels.”
This first chart offers support for their comment above and gives an indication of just how widespread the selling has been.
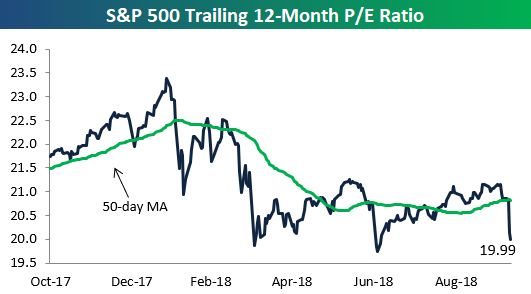
And lastly, the reduction in the market’s multiple is extreme given its swiftness, which could offer interesting entry points for investors.
We’ll keep in close touch as we move thru this trough in trading. dc
1 Source: Bloomberg Market Data
2 Source: Bespoke Investment Group
The views expressed herein are those of Doug Ciocca on October 11, 2018 and are subject to change at any time based on market or other conditions, as are statements of financial market trends, which are based on current market conditions. This information is provided as a service to clients and friends of Kavar Capital Partners, LLC solely for their own use and information. The information provided is for general informational purposes only and should not be considered an individualized recommendation of any particular security, strategy or investment product, and should not be construed as, investment, legal or tax advice. Past performance does not ensure future results. Kavar Capital Partners, LLC makes no warranties with regard to the information or results obtained by its use and disclaims any liability arising out of your use of, or reliance on, the information. The information is subject to change and, although based on information that Kavar Capital Partners, LLC considers reliable, it is not guaranteed as to accuracy or completeness. This information may become outdated and we are not obligated to update any information or opinions contained herein. Articles may not necessarily reflect the investment position or the strategies of our firm.