
2024 Investment Outlook – January 19th, 2024
Market Outlook Summary
- Equity markets began 2024 coming off the strong momentum of a 4th quarter rally to end 2023. The S&P 500 trades near all-time high levels that it hasn’t broken through since early 2022. The “everything” rally, led by small-caps and cyclical sectors pulled forward significant positivity that was lacking in the markets during 2022 and 2023.
- Earnings are expected to be $244 for the S&P 500 for 2024, an increase of +11% compared to 2023. This puts the forward 12-month price-to-earnings (P/E) ratio for the market at 19.6x – two turns above the 10-year average of 17.6x.1 However, we point out that this valuation is skewed by a few heavily weighted stocks and broadening out from these names offers a more attractive opportunity set, where active management could thrive.
- The bond market looks to have the bulk of the rate shocks behind it as the inflation outlook and subsequent Fed reaction has favored normalized interest rates even while the “bond vigilantes” continue to cast concern on the Treasury market. Corporate debt is trading at tight spreads going into the new year but still offers incremental yield.
- The economy continues to cool off after the pandemic stimulus boom and as the tighter monetary policy filters through. But a strong labor market, solid consumer balance sheets, and robust consumer spending along with productivity gains point to an economy that can continue to grow throughout 2024.
- The Fed appears set to complete their pivot from restrictive to accommodative monetary policy during 2024. The FOMC projected three cuts last month, but the bond market is pricing in six2. The time and path of rate cuts will continue to keep the Fed at the forefront of market developments. During 2024 the Fed will be shifting from being restrictive to bring down inflation to being accommodative to keep the expansion going.
- Domestic politics and geopolitical events will continue to possess headline risk for markets, including ongoing armed conflicts and US elections in November.
Last year was a great year for stocks and bonds, with the S&P 500 returning 26% and the Bloomberg US Aggregate returning 5%. Widespread gains broadened out at the end of the year across market caps, styles and geographies in stocks as well as across credit quality and duration profiles in fixed income.3
But as 2023 now sits in the rearview mirror, it’s necessary to move on to 2024 and frame the opportunity set as we see it. This piece is not so much intended to be a forecast for the next 12 months but an outlook on what to watch for and expect as investors. We’ll avoid making precise predictions about markets but will give some rough guidelines of what we think investors should expect from stocks and bonds over the short-term even as we continue to frame investment decision-making with a long-term time horizon in mind.
Equity Outlook
After such a strong year, and with indices near all-time highs, we often see the sentiment amongst investors that the market doesn’t have much more to give but that’s not necessarily the case historically.
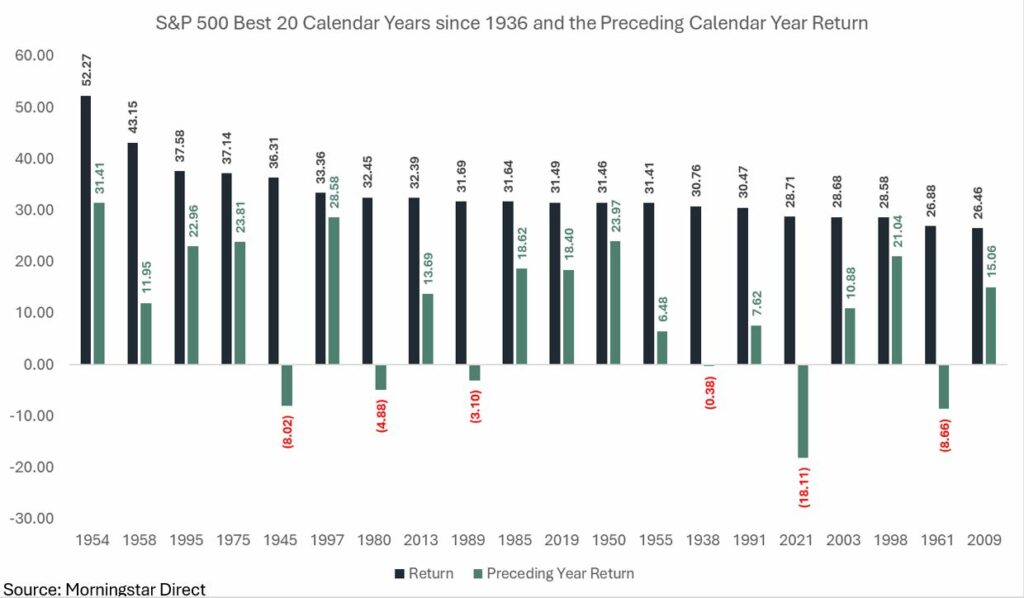
We know that good years tend to follow bad years (not always but usually) as markets rebound and sentiment improves, but good years in the market also tend to cluster together as strength begets strength. Below is a chart of the 20 best calendar years for the S&P 500 since 1936, all with returns greater than last year (2023 ranks as the 21st best year). Note the following observations about the preceding years:4
- 14 out of 20 are positive (70% positive rate, slightly below the historical average)
- Of the positive preceding years, the average return is +18.2%
- Of the negative preceding years, the average return is -7.9%
- Of all the preceding years, the average return is +10.6% (in-line with the historical returns for the index since 1936 of +10.7%)
So, it’s important to clear the slate after an outstanding 2023 and not let the recent experience of the 4th quarter’s exceptional gains cloud our outlook and expect weakness just because of the prior year’s strength. In reality, the S&P 500 is up in 76% of calendar years so consistently negative years are historically uncommon.5
Stepping back further, we view the equity markets in 2024 as coming out of a multi-year period of disruption that included three separate declines of -20% or greater in less than 5 years (2018, 2020 and 2022), an outlier of a stretch for that magnitude and frequency of drawdown. Historically, separate -20% bear markets happen once every 3 ½ years going back to 1936. From year-end 2021 to year-end 2023, stocks have essentially run in place – with only dividends contributing to a total return of +1.7% annualized over the two-year period for the S&P 500. This two-year period ranks in the bottom 20th percentile of two-year returns for the S&P 500 going back to 1936.6
We view the 2023 returns as a recovery from 2022, which was a generationally challenging year for portfolios. In 2024, the macro backdrop takes another step towards normal and is supportive of equity investments as the market continues to make progress from the disruptions of the pandemic. This economic base case includes the following:
- Moderate economic growth buoyed by a strong labor market and consumer.
- A shift to accommodative monetary policy
- Stable interest rates
- Low and falling inflation
- Currency tailwinds
- Tight corporate credit spreads
As there are levels of uncertainty surrounding those conditions, we have to acknowledge the risks to this constructive outlook where a worse-than expected scenario includes:
- The economy slips into recession due to tighter financial conditions deteriorating the labor market and finally breaking the consumer.
- Inflation re-accelerates or plateaus meaningfully above the Fed’s 2% target and causes the Fed to pivot back to hawkish policy.
- Continued pressure on funding the Federal deficit causes further interest rate uncertainty.
- A credit event due to the higher interest rate environment.
- Anything geopolitical. Conflicts in Eastern Europe and the Middle East escalating or a new conflict erupting elsewhere are possibilities. And of course, potentially turbulent US elections.
- And the potential for some “black swan” event that very few see coming (this is always present).
To put it simply, we believe the positives in favor of a continuing expanding economy supporting market gains outweigh the negatives. In another way, as we look at the scenario analysis of outcomes, we view the base case (or a better-than-expected case) to be a higher probability outcome than a worse-than-expected case but acknowledge the inherent risks in that view.
Further supporting equities is the fundamental outlook. Earnings are expected to return to growth in 2024 after essentially going nowhere from Q1 2022 through Q3 2023 including 2 quarters where earnings declined year-over-year. Consensus estimates are for S&P 500 earnings per share to be $244 in 2024 and $275 in 2025; growth of +11% and +12% compared to the prior year’s level. This earnings growth is driven by top-line revenue growth and expanding margins as the inflation picture improves. Earnings growth is expected to be widespread across sectors, with Health Care leading over the next 12-months7:
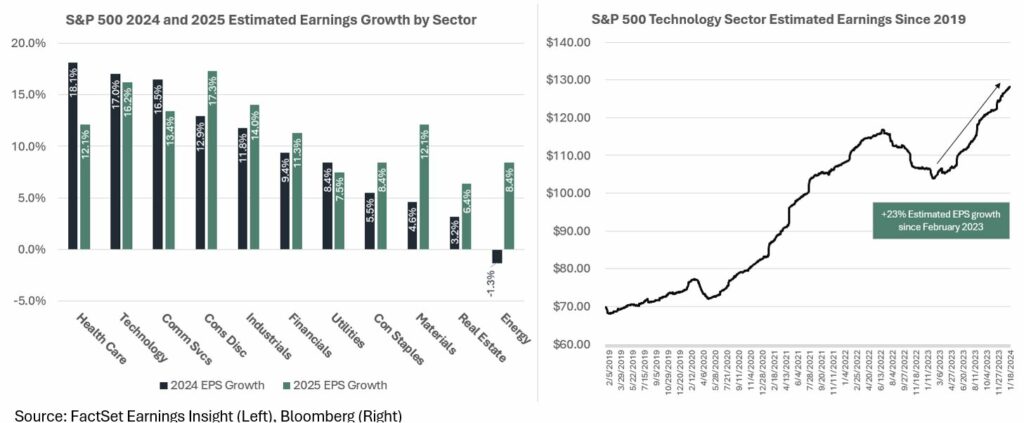
Note in the Technology sector chart on the right, earnings expectations for the market’s largest sector surged after troughing in February 2023, largely due to the boost from the beginning of an artificial intelligence (AI) revolution, of which several Technology companies are the immediate beneficiaries as nearly all companies increase capital expenditures in this area. This positive outlook in the most influential sector lifts the market’s estimates as a whole.
This new frontier that has developed for Technology companies over the past year has added to Growth stocks’ fuel and the increases in their profit outlook has made valuations slightly more palatable for the Growth style. We aim to maintain balance between the Growth and Value styles but continue to tactically allocate by broadening out from the heavily concentrated performance in Large-cap Growth stocks as rebalancing dictates. This necessitates allocating to Value stocks more heavily as we begin 2024.
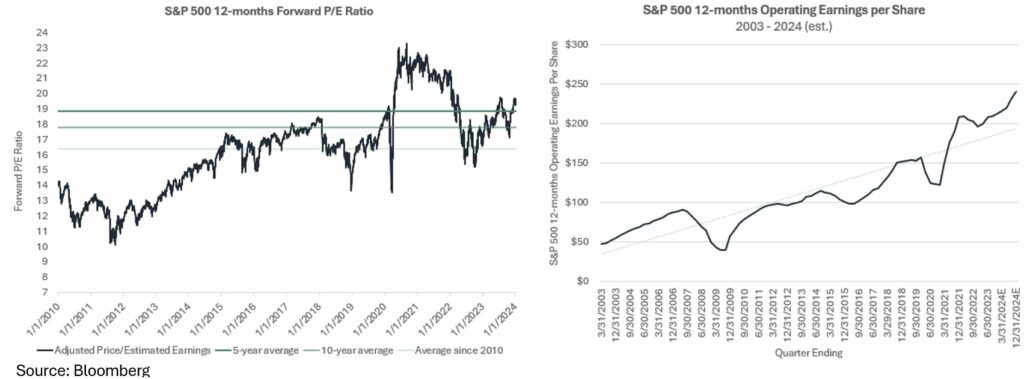
The earnings outlook equates to a forward price-to-earnings (P/E) ratio currently at 19.6x for the S&P 500, elevated from recent average levels. However, the index’s largest holdings have an outsized impact relative to the rest of the components and this concentration at the top skews the figure. The top 10 companies in the S&P 500 trade at a collective 27.1x forward P/E while the other 490 companies trade at 17.2x8
Putting the earnings estimate and market multiple together allow for two simple questions that help us frame equity market expectations over the course of a year:
- Will the estimated earnings outlook for 2024 materialize in reality and how will 2025 expectations change?
- Will the multiple on estimated earnings expand or contract by the end of the year?
While we obviously can’t know the answer to those questions, we would say that the market multiple is more likely to contract than expand from its year-end level of 19.6x but not drastically and if the earnings outlook seems aggressively hopeful, consider that year-over-year earnings growth has averaged +10% since 2009, compensating for the majority of market gains over the time period. And to reiterate, earnings growth stalled in 2022 and 2023 partially due to higher interest rates, higher inflation, and strong currency headwinds that likely have turned into tailwinds in 2024 along with the aforementioned AI boost.9
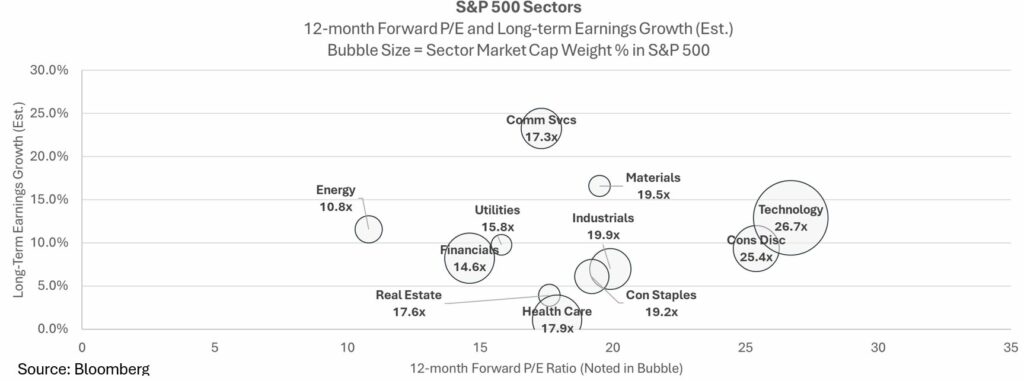
An argument for active management lies under the headline number and the outsized impact of the largest companies. For instance, the Technology sector trades at a 26.7x and pushes the market multiple to its current high level, but sectors like Health Care and Communication Services trade at 17.9x and 17.3x, respectively, while the cheapest sectors, Energy and Financials, trade at 10.8x and 14.6x, respectively.10
Small and Mid-cap Value stocks in the US trade at 15.8x and 14.7x respectively, allowing for a more vibrant opportunity set when decomposing the market than one would expect from headline valuation11. The backdrop of falling rates, falling inflation and an accommodative Fed is even more important to Small and Mid-cap stocks that have balance sheet pressure from elevated interest rates. The cyclical sectors and Value-oriented styles also tend to benefit from these tailwinds.
Outside of the US, International stocks (MSCI ACWI ex-US) trade at 13.1x.12 The valuation discount between US and International has trended increasingly wider since the global financial crisis ended and while a lot of this gap is due to the sector composition of the markets (US is heavy in Technology, where Europe is heavier in Financials, Energy and Consumer Staples for instance), the discount reinforces the investment case to diversify globally.13, 14
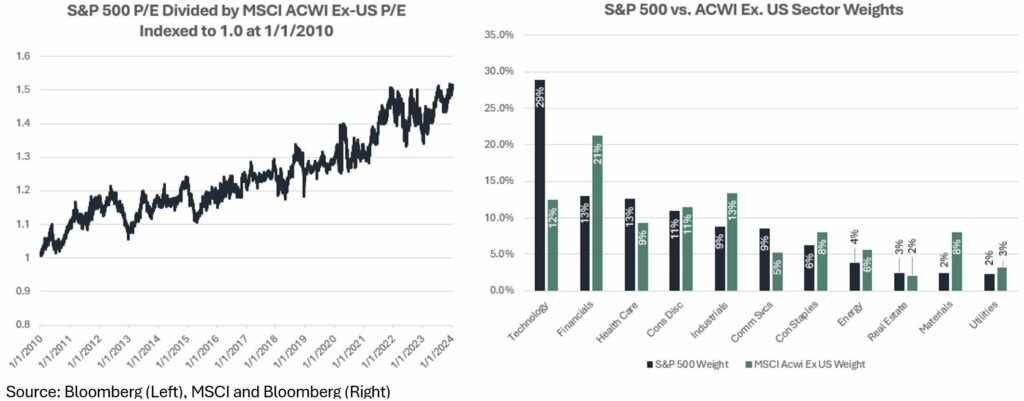
We continue to view US stocks as the best-in-class equity market globally, rely on them as the main growth engine of equity portfolios and remain strategically overweight the US compared to global market caps. However, the diversification benefits of allocating a portion of the equity portfolio to International stocks remains. Historically, US and International stocks have traded periods of outperformance and though the past 15 years has been a stellar period for US over International we can’t say with certainty that US stocks will continue to beat International stocks, and are less certain they will beat by the same magnitude given the valuation discrepancy, even as the US remains the best and most reliable stock market for investors globally we continue to allocate to international stocks, embracing the contrarian nature of rebalancing.
Fixed Income Outlook
In the fixed income markets, we expect the extreme rate volatility of the past 2 years to give way to stability in the Treasury market. The base case is for further disinflation allowing the Fed to pivot to rate cuts. This supports Treasury yields staying within the range of last year’s highs and lows, between 5% and 3.5% on the 10-year Treasury. The short end has pulled forward anticipated Fed actions already and may experience some shifting as Fed plans crystallize. By and large, the volatility caused by exploding inflation and the subsequent historic rise in the Fed Funds rate should dissipate as the economy normalizes.
Further, as cash in the form of rolling Treasuries, Certificate of Deposits (CDs) or simply parking in a money market fund became a popular strategy throughout 2022 and 2023, it may be good timing to consider moving that cash from the sidelines. Bonds tend to outperform cash given the following conditions, according to research from BlackRock15:
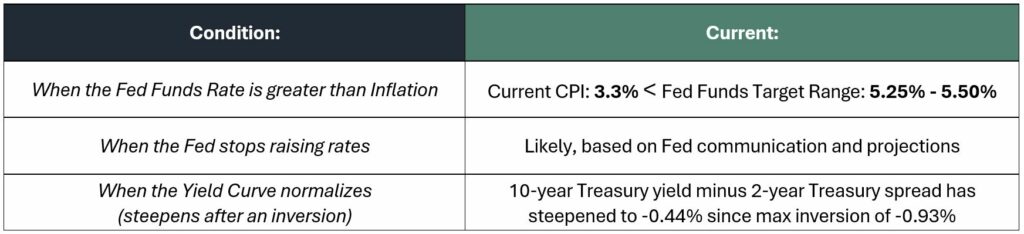
#1 and #3 are met in real-time while #2 is increasingly likely as long as inflation cooperates, creating an environment conducive to moving from cash to fixed income. The lasting impact for bond investors from the 2022 meltdown in bonds is that interest rates today provide a cushion that was absent during the zero-interest rate policy (ZIRP) era. An increase in interest rates is less impactful at higher rates when coupon and accretion to par contribute more to the total return calculation. The potential for rates to move higher at these levels makes the opportunity in active fixed income portfolio management and simple laddered individual bond strategies increasingly attractive.
The risk of further angst surrounding funding the US Federal deficit is the biggest risk to the outlook of stable rates. From rating agencies to the “bond vigilantes” there is obvious pressure on the US to find a sustainable fiscal path and the type of rate shock we saw experienced in October 2023 is not out of the question if the US Treasury has problems efficiently issuing debt to the market. The ongoing reduction in the size of the Federal Reserve’s balance sheet also presents a liquidity concern for the bond markets but has generally worked as intended going back to 2022.
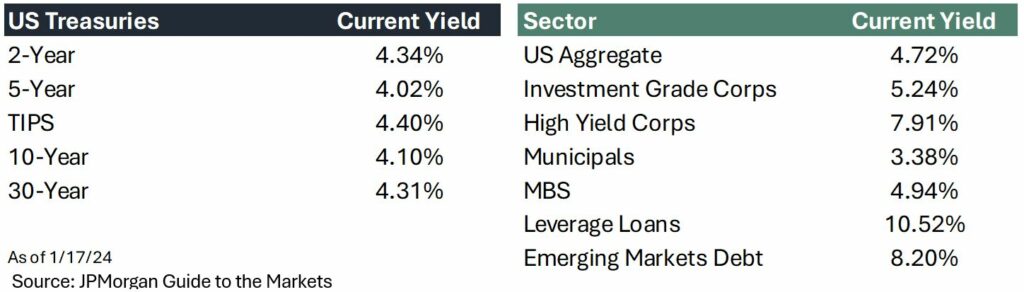
Credit markets have withstood tightening financial conditions and spreads currently sit near historical lows. For large-cap US companies, their ability to issue long-term debt at attractive rates has pushed back a maturity wall that would theoretically cause distress in a higher interest rate regime. Investment Grade and High Yield Corporate bonds trade at tight spreads relative to Treasuries but still provide incremental yield. Floating-rate issues like leverage loans and private credit/direct lending strategies continue to offer even higher yield premiums but come with layers of liquidity, complexity and credit risk. Given spreads current tight levels, it is prudent to remain selective in credit in light of potential spread widening in the event of a deterioration of corporate credit. Today’s yield environment provides for better future return expectations compared to a short time ago across sectors and maturities:
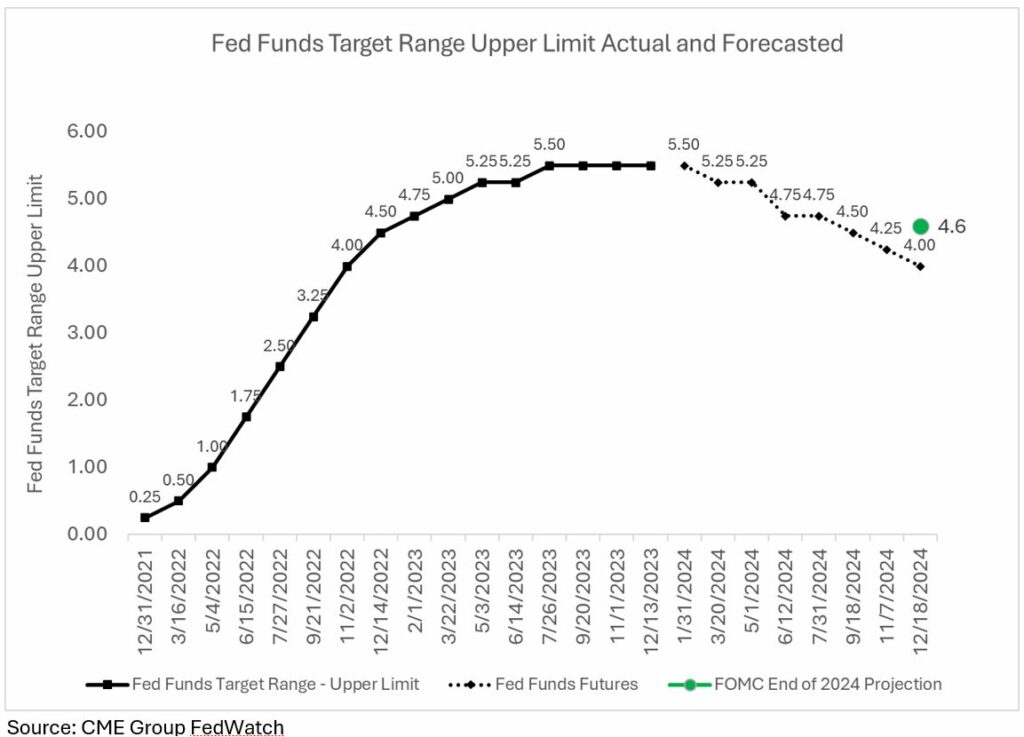
The direction of interest rates and thus bond prices will largely hinge on the actions of the Federal Reserve during 2024. The shift to projecting rate cuts at the end of 2023 was dramatic and boosted asset prices going into year-end but some disconnect remains between Fed projections (three cuts) and the bond market pricing (six cuts beginning in March).16 We think the Fed will cut this year but would look for something in between three and six as the amount while the timing will likely come down to the last few data points to come in prior to the meetings – a March rate cut is not out of the realm of possibilities but would be surprising to our team.
Core PCE, the Fed’s preferred inflation gauge is projected to fall under 2.9% as of December 2023 when data is released later this month with the 3- and 6-month annualized rates running at 1.5% and 1.9% respectively.17,18 The additional downside that is expected from the abnormally lagged reporting of housing inflation should hit the numbers throughout the year. In spite of the optimism surrounding inflation, there is still a scenario where it falls even further and faster than expected. This along with the potential for economic weakness, opens up the possibility of an exceedingly dovish Fed working to keep the economic expansion intact as price stability is fully restored or even overshoots to the downside of the Fed’s inflation target.
We’re hopeful that this outlook provides some insight into the details we’re examining and the considerations we’re giving to portfolio management on a daily basis at Kavar Capital. We’re looking forward to another year in the markets and thank you for your trust in our team. Please reach out with any questions or comments!
- FactSet Earnings Insight https://www.factset.com/earningsinsight
- CME Group FedWatch https://www.cmegroup.com/markets/interest-rates/cme-fedwatch-tool.html
- Morningstar Direct data
- Morningstar Direct data
- Morningstar Direct data
- Morningstar Direct data
- FactSet Earnings Insight https://www.factset.com/earningsinsight
- JPMorgan Guide to the Markets https://am.jpmorgan.com/us/en/asset-management/protected/adv/insights/market-insights/guide-to-the-markets/
- FactSet Earnings Insight https://www.factset.com/earningsinsight
- JPMorgan Guide to the Markets https://am.jpmorgan.com/us/en/asset-management/protected/adv/insights/market-insights/guide-to-the-markets/
- JPMorgan Guide to the Markets https://am.jpmorgan.com/us/en/asset-management/protected/adv/insights/market-insights/guide-to-the-markets/
- JPMorgan Guide to the Markets https://am.jpmorgan.com/us/en/asset-management/protected/adv/insights/market-insights/guide-to-the-markets/
- Bloomberg data
- MSCI https://www.msci.com/www/index-factsheets/msci-acwi-ex-usa/07428682
- BlackRock Student of the Market https://www.blackrock.com/us/financial-professionals/insights/student-of-the-market
- CME Group FedWatch https://www.cmegroup.com/markets/interest-rates/cme-fedwatch-tool.html
- Cleveland Fed Inflation Nowcast https://www.clevelandfed.org/indicators-and-data/inflation-nowcasting
- St. Louis Fed FRED https://fred.stlouisfed.org/series/PCEPILFE
The views expressed herein are those of John Nagle on January 19th, 2024 and are subject to change at any time based on market or other conditions, as are statements of financial market trends, which are based on current market conditions. This market commentary is a publication of Kavar Capital Partners (KCP) and is provided as a service to clients and friends of KCP solely for their own use and information. The information provided is for general informational purposes only and should not be considered an individualized recommendation of any particular security, strategy or investment product, and should not be construed as investment, legal or tax advice. Different types of investments involve varying degrees of risk, and there can be no assurance that any specific investment or strategy will be suitable or profitable for a client’s investment portfolio. All investment strategies have the potential for profit or loss and past performance does not ensure future results. Asset allocation and diversification do not ensure or guarantee better performance and cannot eliminate the risk of investment losses. The charts and graphs presented do not represent the performance of KCP or any of its advisory clients. Historical performance results for investment indexes and/or categories, generally do not reflect the deduction of transaction and/or custodial charges or the deduction of an investment management fee, the incurrence of which would have the effect of decreasing historical performance results. There can be no assurances that a client’s portfolio will match or outperform any particular benchmark. KCP makes no warranties with regard to the information or results obtained by its use and disclaims any liability arising out of your use of, or reliance on, the information. The information is subject to change and, although based on information that KCP considers reliable, it is not guaranteed as to accuracy or completeness. This information may become outdated and KCP is not obligated to update any information or opinions contained herein. Articles herein may not necessarily reflect the investment position or the strategies of KCP. KCP is registered as an investment adviser and only transacts business in states where it is properly registered or is excluded or exempted from registration requirements. Registration as an investment adviser does not constitute an endorsement of the firm by securities regulators nor does it indicate that the adviser has attained a particular level of skill or ability.