
Quarterly Investment Research Note – January 8th, 2024
2023 Market Recap Summary
- Stocks, led by the largest US companies’ extreme outperformance early in the year, and by a broadening of the rally late in the year, experienced a strong bounce back from 2022. Fear of a recession and of “higher-for-longer” interest rates gave way to lower yields and optimism for a “soft landing.”
- Earnings are set to be flat for the year but a return to double-digit growth shaped the forecast for 2024 and 2025, boosting enthusiasm among stock investors.
- The bond market broke a two-year losing streak and finished up on the year. Choppy trading defined this otherwise sedate segment of the financial markets and saw the 10-year US Treasury yield hit a 17-year high (above 5%) before settling at 3.88% to end of the year.1 This yield level was completely unchanged from 2022, following one of the sharpest 2-month bond rallies in history in the 4th quarter.
- The US economy, driven by a strong labor market, continued to defy tighter financial conditions and circumvented a regional banking crisis along the way to not only avoid the “inevitable” recession but surprise to the upside with its growth.
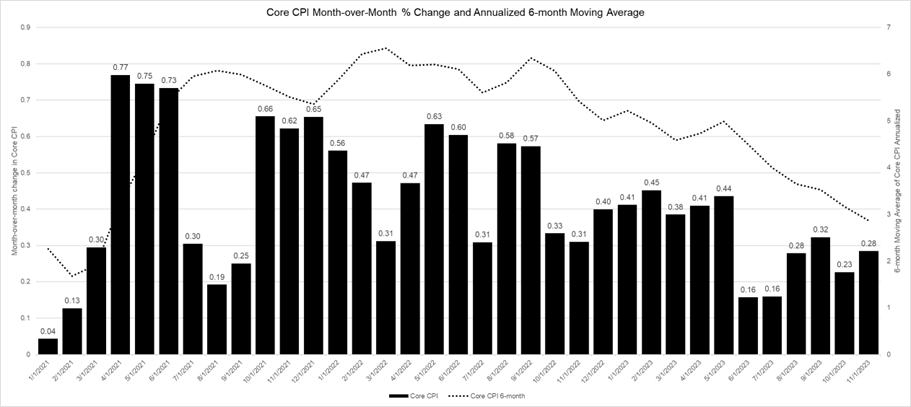
- Inflation continued to move down toward the Fed’s 2% target. Disinflation intensified as supply-side pressures eased, allowing the Fed to pause rate hikes and begin to plan for a pivot with confidence that an economic slowdown and job losses were not necessary to push inflation lower.
4th Quarter 2023 Market Recap
Stocks experienced their best quarter since 2020 with a massive rally in the year’s final two months. 2023 ended on a high note, driven by falling interest rates, falling inflation, and the Fed’s presumed pivot that began to take shape at the Fed’s December meeting. The S&P 500 returned +11.7% during the 4th quarter, finishing the year +26.3%.2
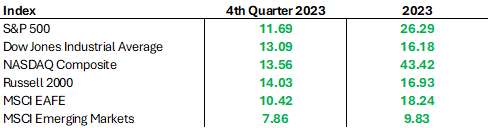
The year in the US stock market will likely be characterized as extremely narrow, as over the first 10 months the “Magnificent 7*” stocks produced parabolic returns while the rest of the market stalled. However, during the 4th quarter, breadth exploded with each industry sector except Energy producing positive returns. Strength was also widespread amongst all market caps and styles (notably Growth AND Value).3
Both the MSCI EAFE (developed countries) and MSCI Emerging Markets participated in the stock rally during the 4th quarter. EAFE finished the year +18.24% while Emerging Markets finished +9.83% in spite of languishing throughout 2023 on weakness in Chinese equities, which lost -11.8% for the year.4
The average S&P 500 stock returned +17.1% from October 27th through the end of the year, besting the market-cap weighted index after lagging throughout most of 2023. And smaller companies surged off their October lows, with the Russell 2000 returning +22.8% between their October 27th and December 31st. For the year, the Russell 2000 was up +16.9%. 5
The Technology sector produced an astounding +57.8% return this year with +17.2% coming in the 4th quarter. The Tech sector bounced back strong as ever after a down year in 2022, sparked by the Artificial Intelligence (AI) theme going mainstream. Other growth sectors like Communication Services and Consumer Discretionary returned +55.8% and +42.4% respectively for the year. 6
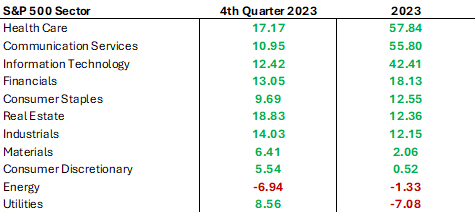
On the opposite end, Utilities had their worst year since 2009, losing -7.1% with rising bond yields causing a major headwind. Energy stocks also struggled due to falling commodity prices; the sector was down -1.33% after being one of the few bright spots in 2022. Healthcare and Consumer Staples were other mediocre performers on the year.7
Regional Banks were a specific area of poor performance for the year but also one that snapped back to close it out; the industry benchmark lost -7.4% for the year but was up +26.7% during the 4th quarter.8
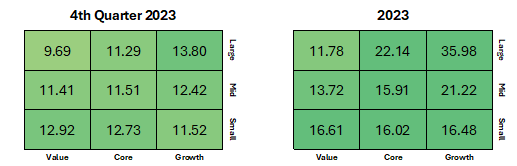
Growth stocks returned to dominance during the year. Large-cap Growth outperformed Large-cap Value by a spread of +31.2% for 2023, entirely wiping out Large-cap Value’s return advantage it generated 2022. The Growth style was aided by the strength in Technology and Communication Services stocks and led by the aforementioned Magnificent 7. Traditional Value characteristics like high dividend payers were out of favor. The S&P Dividend Aristocrats Index (companies that have increased their dividends every year for the last 25 years) returned +8.4% for the year with nearly all of that increase coming during the 4th quarter.9
The bond market experienced an eventful 12-months as well but rallied hard to close the year and to produce positive returns; the Bloomberg US Aggregate Bond Index was up +6.8% during the 4th quarter, the best single quarter for the index since the 2nd quarter of 1989. For the year, the bond market was up +5.5%. Duration paid off during the 4th quarter as rates fell across the board – the Bloomberg US Treasury 20+ Year Index rose +13.4% during the quarter.9
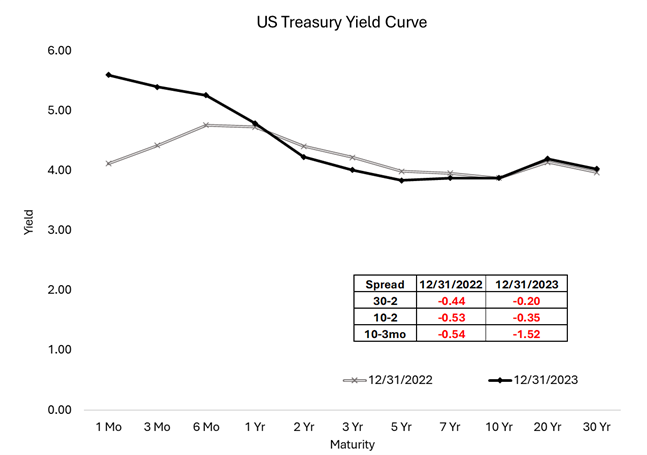
The yield curve steepened slightly for the year based on traditional measures of the 30-year Treasury yield minus the 10-year Treasury or 2-year Treasury yields. The 2-year yield finished lower by 18 basis points (1/100th of 1%) for the year as Fed expectations downshifted.10
During the 4th quarter, a rise in the term premium signaled concern for bondholders regarding the Federal deficit as the amount and composition (the mix of maturities to issue) of Treasury issuance went under the microscope in an unprecedented way. The 10-year yield rose throughout the summer as the regional banking crisis faded but took off in October breaking the 5% barrier for the first time in 17 years. The frenzy reached its peak ahead of the Treasury’s Quarterly Refunding Announcement at the end of October where the simple result of planning to issue less debt than initially expected was enough to calm the bond market.
Credit also produced a strong year as recession fears faded. Investment-grade Corporates and High Yield Corporates were up +9.5% and +13.5% for the year, respectively. Bank loans were up +13% for the year as spreads tightened and higher yields continued to benefit floating rate issues. Globally, Emerging Markets debt was a strong area, returning +10.6% for the year.11 The US dollar weakened -2.4% vs. the trade-weighted basket of global currencies throughout the year, providing a tailwind to local currency strategies.12
The benchmark 60/40 portfolio (60% S&P 500 / 40% Bloomberg US Aggregate Bond) returned +18% for the year and 9.9% in the 4th quarter after finishing down -16.9% in 2022, its worst year since 2008.13
The Economy, Inflation, and the Fed
Coming into the year, the consensus opinion among economists that a recession during 2023 was nearly a foregone conclusion based on the extreme measures taken by the Fed to tighten financial conditions. The long and variable lags of monetary policy were due to drive economic weakness in 2023. It was a completely rational opinion based upon historical precedent, however, history has proved to be a poor guide for economic developments post-pandemic.
The economists underestimated the strength of the US consumer which makes up two-thirds of the US economy. The country added 2.7 million jobs during 202314, the unemployment rate remained firmly under 4% and wage growth kept pace with the rise in prices keeping consumption strong. Corporations smartly locked in long-term financing at attractive rates during the low interest rate era so they were not as impacted by the Fed rate hikes as may have been expected. Higher mortgage rates impeded housing market activity, but price declines were modest, and homeowners continue to enjoy robust home equity adding to their net worths with most mortgages locked in at low, fixed interest rates.
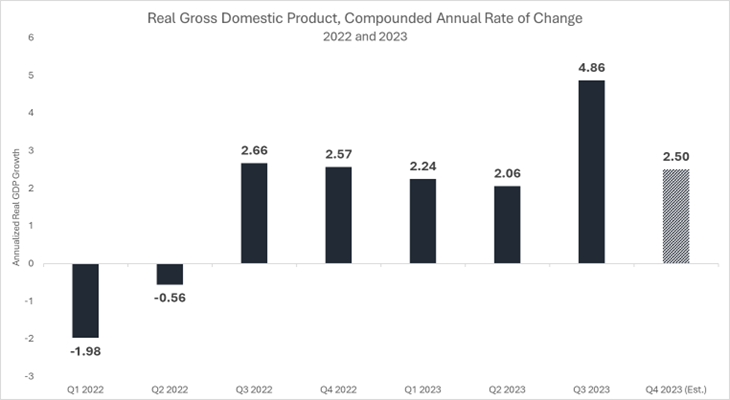
The end result of strong consumption was surprisingly strong economic growth during the year. But, the development and trajectory of disinflation is the other catalyst leading to optimism around the “soft-landing” scenario of the US economy. Inflation, defined by CPI, fell to 3.12% through November 2023, while Core CPI (inflation excluding food and energy) fell to 3.99%, significant progress in the battle against higher prices. The decline intensified for Core CPI during the final months of the year, with the 6-month annualized rate running at 2.85% as of November 2023.15
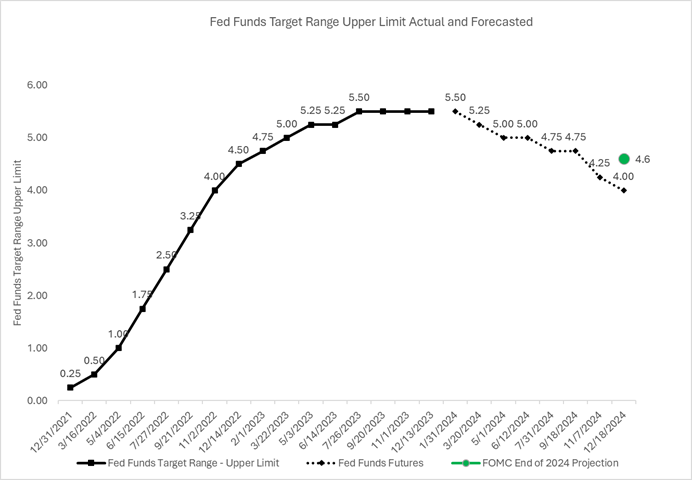
Declining inflation, in a stable economy that continues to add jobs has allowed the Fed to shift their tone from hawkish to neutral by the end of the year and during the final Fed meeting in December, they began to discuss the prospects for rate cuts during 2024. The Fed made the shift as they ultimately believe it’s time to start talking about keeping the expansion going as their work on price stability is nearly (but not certainly) accomplished.
The Fed put three projected rate cuts during 2024 into their forecast in December of 2023; but the bond market has been much more aggressive – pricing in six cuts. The presumed pivot by the Fed, regardless of the disconnect between the Fed and the futures market, set off the rally in stocks and bonds to end 2023 and will represent a key data point to watch in the coming year.16,17
2023 was a strong year for portfolios – a welcome rebound after a challenging 2022. The markets are progressing towards normalization after an intense period of disruption caused by the pandemic and 2023 was another step towards that new normal.
We hope your new year is off to a great start, we plan to follow-up on this recap with a forward-looking 2024 preview later this month, please reach out with any questions at any time!
Footnotes:
* The “Magnificent 7” is a basket of seven tech-focused large-cap stocks in the US that drew significant media attention during 2023: Alphabet ( GOOGL), Amazon (AMZN), Apple (AAPL), Meta Platforms (META), Microsoft (MSFT), Nvidia (NVDA) and Tesla (TSLA).
- US Treasury data https://home.treasury.gov/policy-issues/financing-the-government/interest-rate-statistics
- Morningstar Direct data
- Morningstar Direct data
- Morningstar Direct data
- Morningstar Direct data
- Morningstar Direct data
- Morningstar Direct data
- Morningstar Direct data
- Morningstar Direct data
- US Treasury data https://home.treasury.gov/policy-issues/financing-the-government/interest-rate-statistics
- Morningstar Direct data
- St. Louis Fed https://fred.stlouisfed.org/series/DTWEXBGS
- Morningstar Direct data
- St. Louis Fed https://fred.stlouisfed.org/series/PAYEMS
- St. Louis Fed https://fred.stlouisfed.org/series/CPILFESL
- Federal Reserve https://www.federalreserve.gov/monetarypolicy/files/fomcprojtabl20231213.pdf
- CME Group FedWatch https://www.cmegroup.com/markets/interest-rates/cme-fedwatch-tool.html
The views expressed herein are those of John Nagle on January 8th, 2024 and are subject to change at any time based on market or other conditions, as are statements of financial market trends, which are based on current market conditions. This market commentary is a publication of Kavar Capital Partners (KCP) and is provided as a service to clients and friends of KCP solely for their own use and information. The information provided is for general informational purposes only and should not be considered an individualized recommendation of any particular security, strategy or investment product, and should not be construed as investment, legal or tax advice. Different types of investments involve varying degrees of risk, and there can be no assurance that any specific investment or strategy will be suitable or profitable for a client’s investment portfolio. All investment strategies have the potential for profit or loss and past performance does not ensure future results. Asset allocation and diversification do not ensure or guarantee better performance and cannot eliminate the risk of investment losses. The charts and graphs presented do not represent the performance of KCP or any of its advisory clients. Historical performance results for investment indexes and/or categories, generally do not reflect the deduction of transaction and/or custodial charges or the deduction of an investment management fee, the incurrence of which would have the effect of decreasing historical performance results. There can be no assurances that a client’s portfolio will match or outperform any particular benchmark. KCP makes no warranties with regard to the information or results obtained by its use and disclaims any liability arising out of your use of, or reliance on, the information. The information is subject to change and, although based on information that KCP considers reliable, it is not guaranteed as to accuracy or completeness. This information may become outdated and KCP is not obligated to update any information or opinions contained herein. Articles herein may not necessarily reflect the investment position or the strategies of KCP. KCP is registered as an investment adviser and only transacts business in states where it is properly registered or is excluded or exempted from registration requirements. Registration as an investment adviser does not constitute an endorsement of the firm by securities regulators nor does it indicate that the adviser has attained a particular level of skill or ability.