
Investment Research Note – January 20th, 2023
2023 Outlook
Early on in 2023, markets are assessing the landscape for assets as the end of 2022 left many loose ends untied – particularly surrounding tighter monetary policy and its lagged impact on the economy. As we prepare for another eventful year in the financial markets, we wanted to highlight some key areas we’ll be watching closely and to offer some long-term perspective.
Inflation/Fed
During 2022, the Fed embarked on the most aggressive pace of tightening since the early 1980s to bring down inflation – increasing the Fed Funds Target Range from 0-0.25% to 4.25-4.50%1. Throughout most of the year, inflation readings surprised to the upside and proved to be stickier than central banks anticipated. Further, the inflation situation was exacerbated by the Russian invasion of Ukraine and by China’s long-lasting COVID lockdowns. These dynamics coupled with the extreme growth in the money supply and zero interest rates created a perfect storm for textbook inflation: too much money chasing too few goods and services.
As we sit today in 2023, the tightening is ongoing but is nearing an end. However, there is considerable debate around when it ends (how many more hikes) and what’s next (pause or pivot to cutting rates) for the Fed.
A sizeable gap now exists between what the Fed is communicating and what the bond market is pricing which indicates the bond market is either A) calling the Fed’s bluff and is front running a change in policy or B) believes the data will change throughout the year that will force the Fed’s hand into accommodation.2,3,4
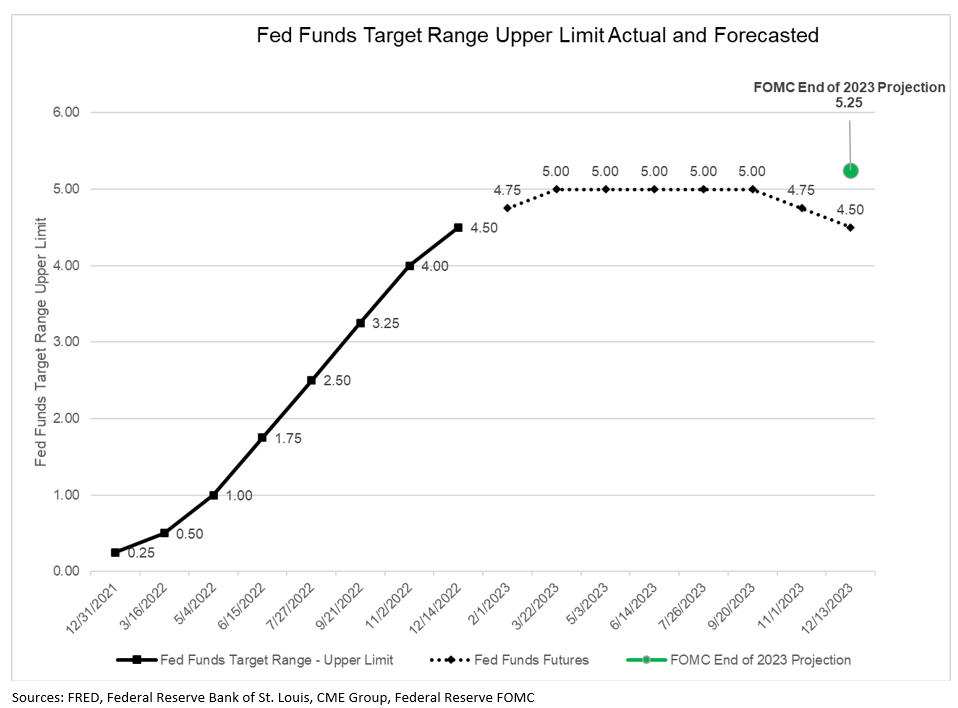
The chart above shows the rate hikes undertaken during 2022 and the bond market’s indication for what’s priced in for 2023, with the green dot representing the FOMC’s estimate for the Fed Funds Rate for the end of this year.
The bond market is still pricing in a terminal Fed Funds rate below 5% and then rate cuts late in 2023; this is the “pivot” camp. However, Fed speakers have remained adamant about a terminal rate above 5% with no rate cuts projected this year – the “higher for longer” camp. This debate is likely to rage throughout 2023 and will largely be driven by unfolding inflation data. How the Fed reacts is ultimately the most important piece of macro information in the next few months.5
Headline inflation is showing significant signs of slowing, with CPI and Core CPI annualizing at 1.88% and 4.46% respectively over the past 6 months through December 2022.6,7
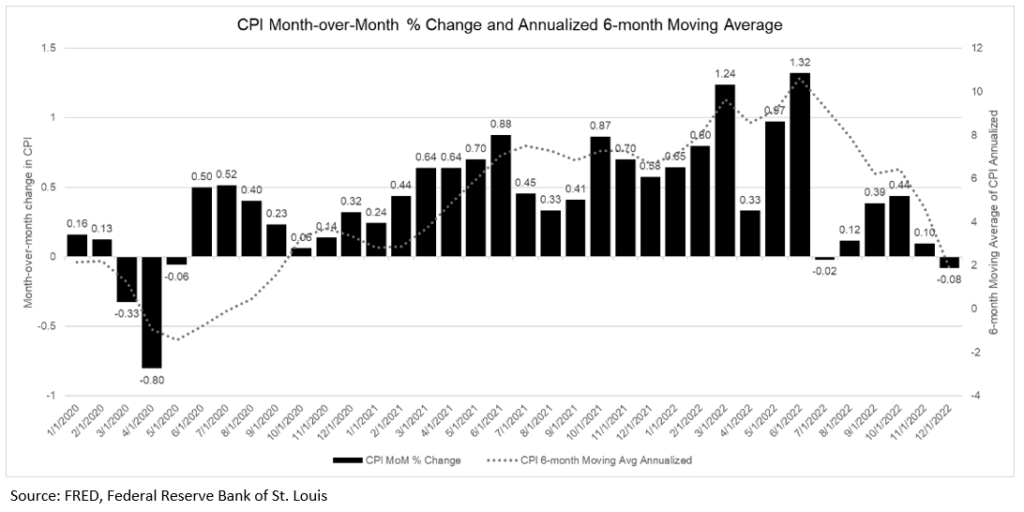
This is largely driven by falling prices in Energy, core durable goods like used cars, home appliances, and significant disinflation in other goods prices as supply chain and inventory issues are resolved. What the Fed is focused on though is the “stickier” component of inflation, which is the services components that have not seen the moderation that goods have.
There are two main points to watch regarding services inflation in 2023:
- The Fed clearly links higher wage growth to higher services Inflation. Wage growth has been running hot due to the tight labor market, post pandemic, but has started to ease off of its highs. So, it bears monitoring for moderation in wage growth. This moderation should signal to the Fed that services inflation has peaked.
- The largest component of all inflation is shelter costs. Due to oddities in how the data is collected by the government, the price changes of shelter are very lagged to the point that CPI shelter costs continue to increase at high rates while real-time data shows shelter costs have softened over the past several months. When this lagged data works its way into the inflation data it should aggressively diminish the inflation picture.
Another key development has been the declining growth in the money supply. The money supply is essentially the amount of money (cash, coins, checking and savings accounts, etc.) in circulation in an economy and this grew in historic ways due to the stimulus measures put in place during the pandemic. This excess money in the system played a major role in increasing inflation but is slowly working its way out of the system – a positive sign for lower future inflation. Money supply growth has collapsed to the point where it is actually projected to have decreased during 2022 (this would be the first calendar year it has not increased going back to 1960) and is decreasing consistently on a month-to-month basis.8
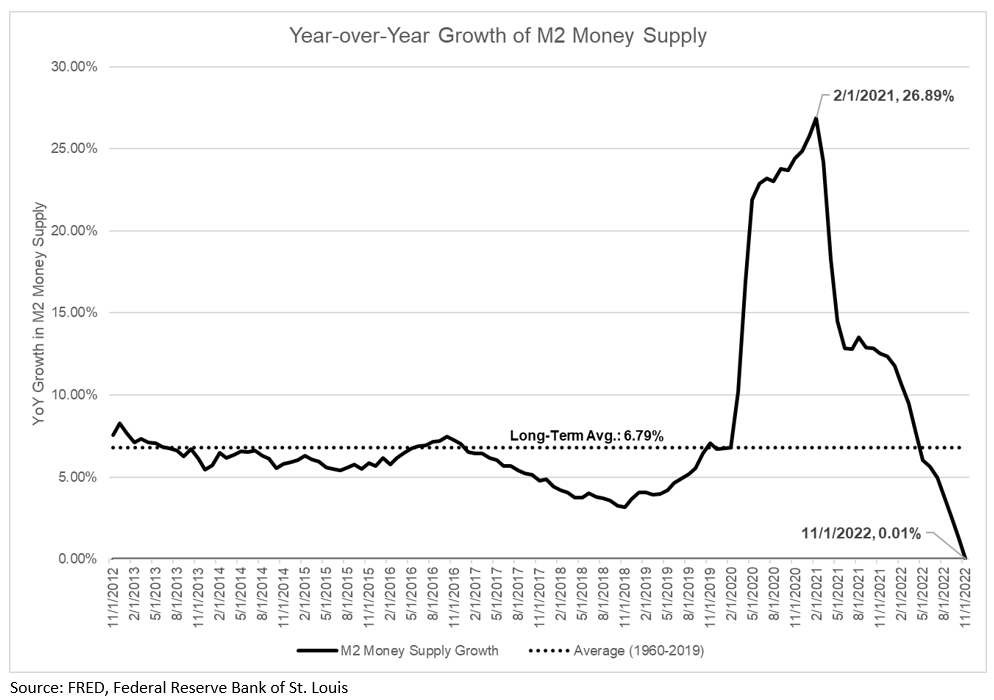
Money has gone from being cheap and ubiquitous to expensive and scarce in short order – an environment that is now conducive to lower inflation. The Fed is still largely in control of markets right now but with the inflation outlook improving, there is optimism that these macro headwinds are dissipating.
Soft Landing or Hard Landing
As we heard repeatedly throughout 2022, monetary policy works with “long and variable lags,” whereby the impacts of each decision can take months (or longer) to work its way through the system and sometimes with unintended consequences. We are just now seeing the impact of rate hikes and quantitative tightening. Whether the Fed can accomplish a “soft landing”- bringing down inflation without wrecking the economy – will begin to crystallize during 2023.
The economy is presumably on a delicate footing and a 2023 recession has become a base case for many Wall St. economists. A recent Bloomberg survey found 70% of economists expect a recession in the next 12 months9. While it seems like a foregone conclusion, recall that a recession last year also felt inevitable as the US produced 2 consecutive negative quarters of real GDP growth. However, it will likely not be labeled a recession as the economy picked up steam in the 2nd half.
Still, it’s easy to be bearish on the economy right now considering the tightening of financial conditions, the inverted yield curve, a slowdown in housing, layoffs at well-known tech companies, falling PMI’s and the fact that almost everybody is saying it you can talk yourself into it. The herd mentality is strong.
The major wrench in the economic bear case is the strength of the consumer, courtesy of the strong labor market. Consider these data points:
- The unemployment rate is 3.5% as of December 202210,
- The economy added 4.5 million jobs during 202211,
- With over 10 million job openings as of November 202212.
- Real Personal Incomes and Real Retail Sales, key recession variables, are not weakening as you’d expect immediately prior to a recession13,14.
It is important to note that the labor market is a lagging indicator of economic weakness, but the strength of the consumer certainly runs counter to the consensus for economic weakness. The situation is dynamic, so we’ll continue to watch the data as we wait for monetary policy to filter through the economy and determine whether we’ll have a hard or soft landing. And ultimately it is the economy that will drive what we see out of corporate America and the stocks and bonds in which we invest.
Earnings/Valuations
The earnings outlook has been weakening – in both actual results as we moved through 2022 and in estimates for 2023. S&P 500 Q4 2022 earnings are tracking for a year-over-year decline of -1.2% which would be the first quarterly decline since Q3 202015. More importantly, estimates for 2023 have also fallen considerably over the past 6 months largely driven by reductions in Q1 and Q2 2023 estimates:
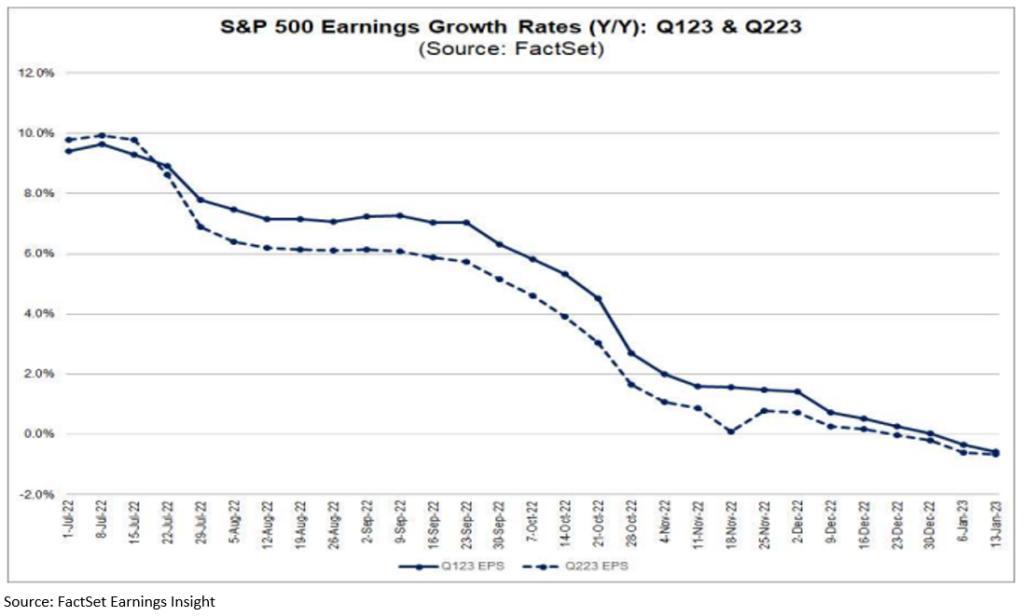
As of 1/16/23 the estimate for S&P 500 earnings is $228.27/share for the full year 2023 (growth of just +4.0%) which would be the lowest growth in earnings for a year since 201916. Margins will be a focus during the 1st and 2nd quarter as companies are being forced to tighten their belts in the new macro environment and control costs, particularly in the Technology sector.
This all begs the question of whether 2023 estimates are too optimistic given the above-mentioned financial condition tightening and grim economic outlook. This has also become another popular negative narrative around the markets. An “earnings recession” where we see earnings decline for several quarters compared to the year prior is already the base case for Street estimates, so some of it is priced in, but as always it will depend on the magnitude and whether the numbers come out “better or worse” rather than “good or bad”. Keep in mind that historically S&P 500 companies have beaten estimates by +5.4% over the past five years17, so history is on the side of companies outpacing estimates.
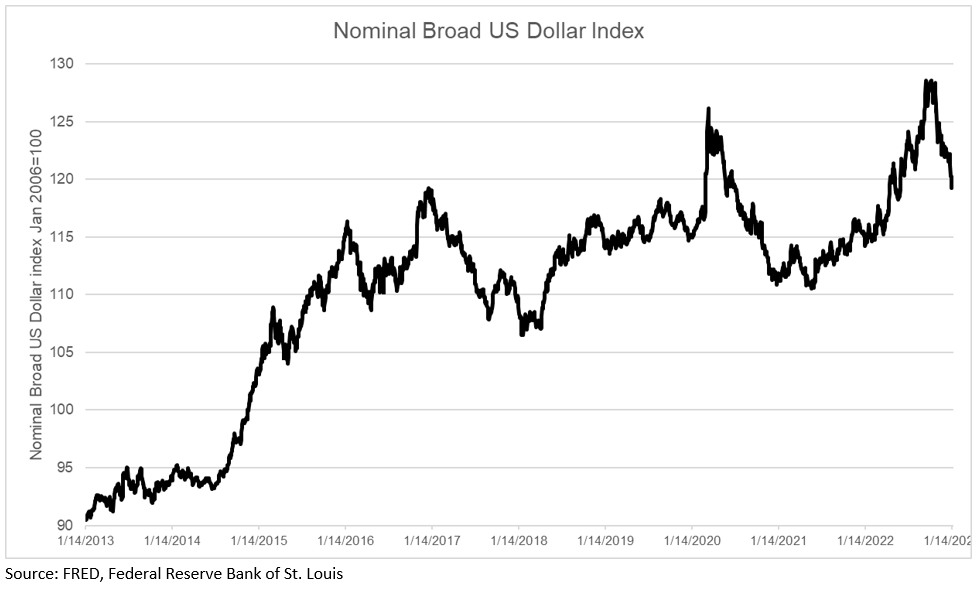
As we look into the 2nd half of 2023 and onto 2024, the earnings outlook brightens considerably. With estimates calling for the S&P 500 to produce +10.7% earnings growth in 2024 – a welcome return to double-digit growth18. The weakening US Dollar could be a windfall to US multinational companies as currency becomes a tailwind rather than the headwind it has been for the past 2 years19:
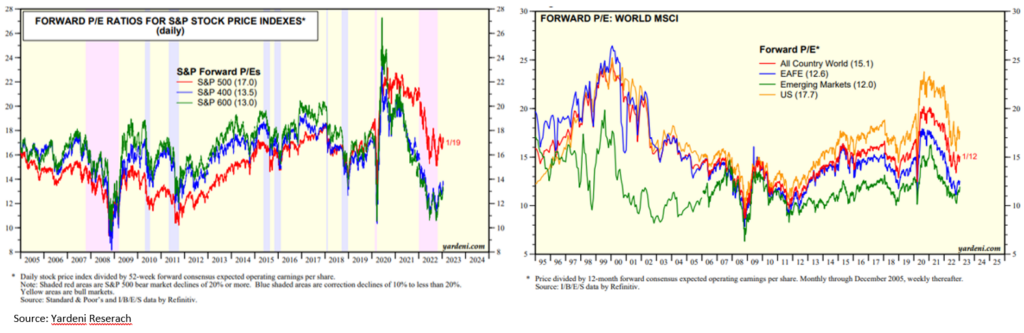
The other side of the coin is how much the market is willing to pay for these earnings. As of 1/19/23 the S&P 500 is trading at roughly 17x the next 12 months’ earnings – which is right on the average P/E multiple for the past 10 years20.
From a portfolio perspective, cheaper valuations both absolute and relative to history, can be found by broadening out from the S&P 500 mega-cap exposure and looking to mid and small-cap companies. Globally, valuations remain considerably cheaper in international stocks relative to the US21:
Our most important takeaway with valuations is that they tell little about near-term returns but a lot about long-term returns. Valuations got cheaper, across the board, for stocks during the 2022 downturn which has boosted our long-term expectations but that doesn’t alter expectations for 2023.
Historical Perspective
We’ll conclude with some simple perspective as it’s helpful to step back as long-term investors and look to history to draw comparisons on where we’ve been and where we go from here.
Bear markets (as defined by -20% drawdowns from all-time highs based on closing prices) are common for stocks. Since 1945 they have occurred about every 6 years22. Granted, we’ve now experienced 2 in the span of 3 years, so it may feel different but historically there is precedent for a drop of this nature in the S&P 500:
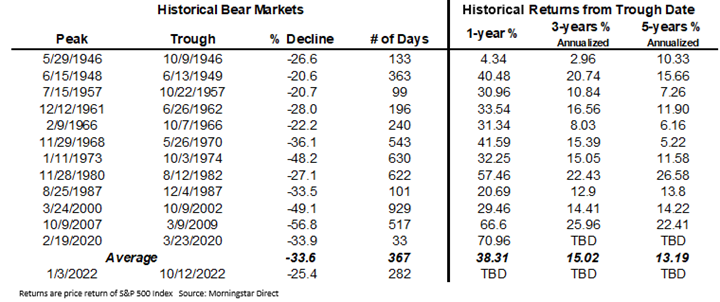
Each bear market is different in its length, magnitude, and other quantifiable characteristics as well as the catalysts that cause it, but all are nevertheless extremely unsettling for investors. Time will tell if the October 2022 low will hold as the bottom for this current bear, but recoveries from these market downturns have historically been strong which belays the point that as the market sells off forward returns tend to improve, and patient investors are rewarded.
We look forward to keeping in close touch as we move through 2023, we expect there to be lots to discuss so please reach out to our team with questions/comments on how the information presented in this update is impacting your portfolio specifically.
Footnotes:
- https://fred.stlouisfed.org/series/DFEDTARU
- https://fred.stlouisfed.org/series/DFEDTARU
- https://www.cmegroup.com/markets/interest-rates/cme-fedwatch-tool.html?redirect=/trading/interest-rates/countdown-to-fomc.html
- https://www.federalreserve.gov/monetarypolicy/files/fomcprojtabl20221214.pdf
- https://www.cnbc.com/2023/01/11/markets-dont-believe-the-fed-when-it-comes-to-where-rates-are-headed.html
- https://fred.stlouisfed.org/series/CPIAUCSL
- https://fred.stlouisfed.org/series/CPILFESL
- https://fred.stlouisfed.org/series/M2SL
- https://www.bloomberg.com/news/articles/2022-12-20/economists-place-70-chance-for-us-recession-in-2023
- https://fred.stlouisfed.org/series/UNRATE
- https://fred.stlouisfed.org/series/PAYEMS
- https://fred.stlouisfed.org/series/JTSJOL
- https://fred.stlouisfed.org/series/W875RX1
- https://fred.stlouisfed.org/series/RRSFS
- https://www.yardeni.com/pub/yriearningsforecast.pdf
- https://www.yardeni.com/pub/yriearningsforecast.pdf
- https://advantage.factset.com/hubfs/Website/Resources%20Section/Research%20Desk/Earnings%20Insight/EarningsInsight_011323.pdf
- https://www.yardeni.com/pub/yriearningsforecast.pdf
- https://fred.stlouisfed.org/series/DTWEXBGS
- https://www.yardeni.com/pub/stockmktperatio.pdf
- https://www.yardeni.com/pub/stockmktperatio.pdf
- https://www.yardeni.com/pub/sp500corrbeartables.pdf
The views expressed herein are those of John Nagle on January 20th, 2023 and are subject to change at any time based on market or other conditions, as are statements of financial market trends, which are based on current market conditions. This market commentary is a publication of Kavar Capital Partners (KCP) and is provided as a service to clients and friends of KCP solely for their own use and information. The information provided is for general informational purposes only and should not be considered an individualized recommendation of any particular security, strategy or investment product, and should not be construed as, investment, legal or tax advice. Different types of investments involve varying degrees of risk, and there can be no assurance that any specific investment or strategy will be suitable or profitable for a client’s investment portfolio. All investment strategies have the potential for profit or loss and past performance does not ensure future results. Asset allocation and diversification do not ensure or guarantee better performance and cannot eliminate the risk of investment losses. Charts and graphs presented do not represent the performance of KCP or any of its advisory clients. Historical performance results for investment indexes and/or categories, generally do not reflect the deduction of transaction and/or custodial charges or the deduction of an investment management fee, the incurrence of which would have the effect of decreasing historical performance results. There can be no assurances that a client’s portfolio will match or outperform any particular benchmark. KCP makes no warranties with regard to the information or results obtained by its use and disclaims any liability arising out of your use of, or reliance on, the information. The information is subject to change and, although based on information that KCP considers reliable, it is not guaranteed as to accuracy or completeness. This information may become outdated and KCP is not obligated to update any information or opinions contained herein. Articles herein may not necessarily reflect the investment position or the strategies of KCP. KCP is registered as an investment adviser and only transacts business in states where it is properly registered or is excluded or exempted from registration requirements. Registration as an investment adviser does not constitute an endorsement of the firm by securities regulators nor does it indicate that the adviser has attained a particular level of skill or ability.