
Quarterly Investment Research Note – January 13th, 2023
4th Quarter 2022 Review
Although markets posted positive returns in the 4th quarter of 2022, the volatility that troubled investors all year remained present throughout; largely driven (again) by an increasingly aggressive Federal Reserve in their pursuit of lower inflation and subsequent economic concerns filtering through to public company guidance. And while the 4th quarter provided relief from falling prices, the returns were unable to offset the broad indices’ weakness of the first 3 quarters.
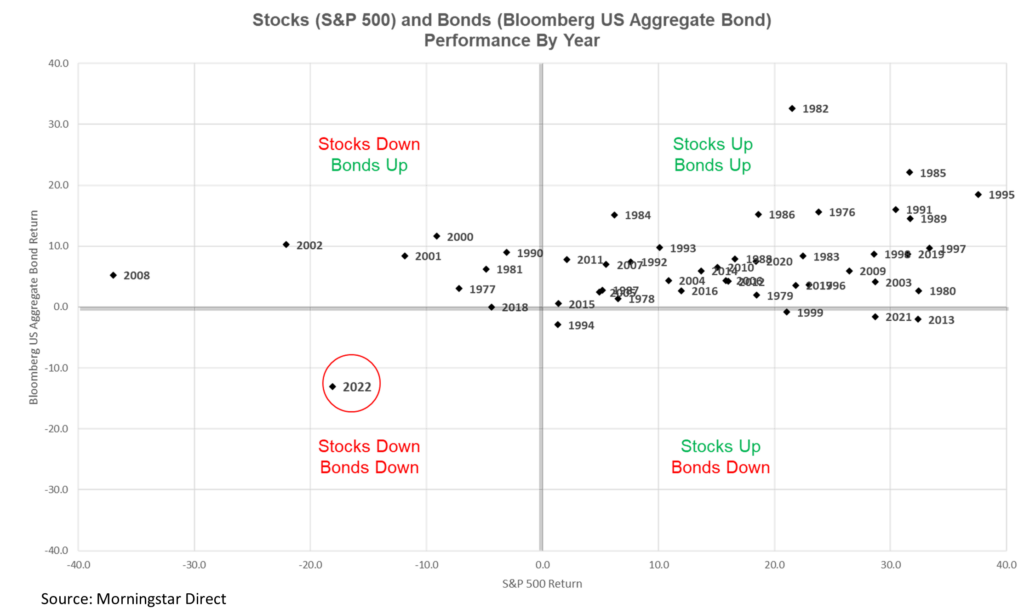
The calendar year of 2022 will go down as one of the worst in history for “balanced” investors. Rising yields pushed bond prices down alongside stocks in an unfamiliar fashion. A 60/40 portfolio comprised of 60% S&P 500 Equity Index and 40% Bloomberg US Aggregate Bond Index fell -16.1% during 2022; its worst year since 2008 and only the 2nd year since 1980 when both components were negative1.
The exhibit below shows the annual returns for the S&P 500 Index and Bloomberg US Aggregate Bond Index and how 2022 will go down as an outlier for their positive correlation…..in a negative direction. Bonds have historically cushioned investors during years with poor stock returns; in 2022 this was not the case2.
A long-term silver lining does exist after a year of liquidity extraction and a general wringing out of excesses. Higher bond yields now provide the best expected return for fixed income in more than a decade.3 Equity valuations have compressed to more palatable levels. The tightening of financial conditions during 2022 was a difficult transition for investors but this year, in our opinion, should bring an end to the cycle. The 1st parts of 2023 are widely expected to remain choppy while the Fed continues to figure out inflation and the market continues to figure out the Fed but the prospects for recovery from the bear market get brighter with each passing day.
Equity
During the 4th quarter stocks largely gained, particularly on the Value side (a persistent trend in 2022) as Growth stocks lagged. The Dow Jones Industrial Average finished 2022 down only -6.86%, assisted by its lower allocation to Technology companies relative to the S&P 500 and NASDAQ Composite which saw declines of -18.11% and -32.54% respectively for the year. The Russell 2000 Index (small-cap stocks) finished 2022 down -20.44% with a gain of +6.23% during the 4th quarter. Interestingly the Russell 2000 held its lows of June 2022 while the large-cap indices made new lows in October 2022.
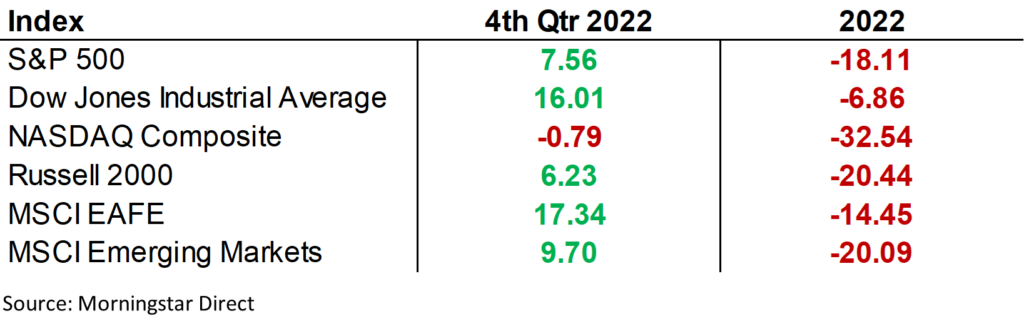
For the first time since 2017, Developed market international stocks outperformed the S&P 500 as the MSCI EAFE saw great strength in Q4, rallying +17.34% with the tailwind of a weakening US Dollar and finishing the year down -14.45%. MSCI Emerging Markets also had a strong Q4, returning +9.70% to finish the year down -20.09%. The strength in international stocks over the last few months was a pleasant shift for globally diversified equity investors.5
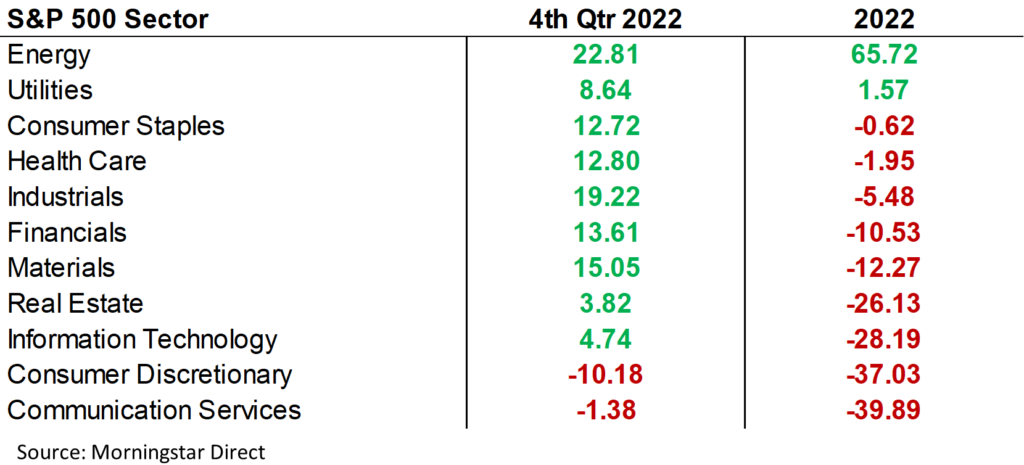
Within the US, Energy stocks were the standout sector on the year. Energy companies returned 22.81% during the 4th quarter and +65.72% during 2022 boosted by strong commodity prices. Technology, Consumer Discretionary and Communication Services were the largest laggards, experiencing outsized losses largely due to multiple compression. Traditional safe-havens, Utilities, Consumer Staples and Healthcare provided relatively strong returns near the flat-line for the year.6
The mega-cap Technology, Consumer and Communication Services holdings, which make up a substantial weight at the top of the market-cap weighted S&P 500 worked to drag down the index. In comparison, the equal-weighted version of the S&P 500 (equal weight given to each company) fared much better, returning -11.45% during 2022.7
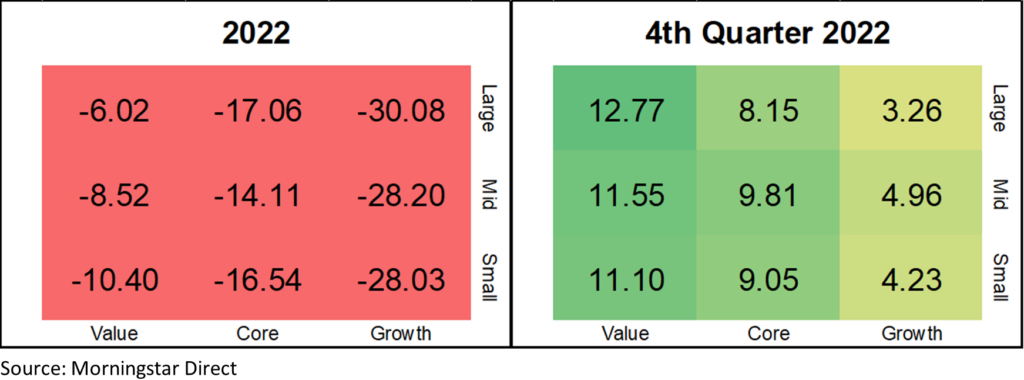
A defining characteristic of returns during 2022 was the weakness in Growth stocks after years of outperformance vs. the Value style. As rates rose and liquidity drained from the system, long-duration cash flows came under pressure. The market simply refused to pay premium multiples any longer for high growth/low profitability business models. The Russell 3000 Value outpaced the Russell 3000 Growth by +20.99% during the year.8
Fixed Income
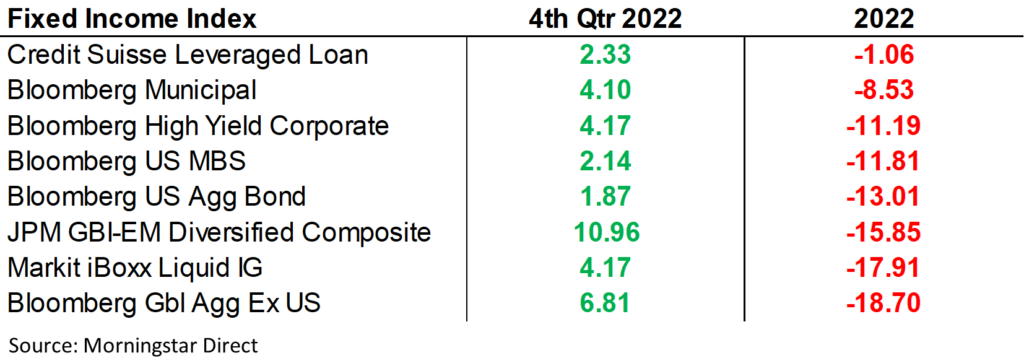
Rising rates pushed bond prices down in a way not seen since the 1970s. The Bloomberg US Aggregate Bond Index fell -13% for the year and at one point was down -18% from it’s all-time high. The -13% was only the fifth negative year for the index since its inception in 1980; but the magnitude was exceptionally painful as the prior down years were all down less than -3%.9
Credit spreads remained somewhat muted relative to the volatility in the markets10, but corporate issues were still impacted by rising rates. Leveraged Loans were a relative bright spot given their floating-rate nature.
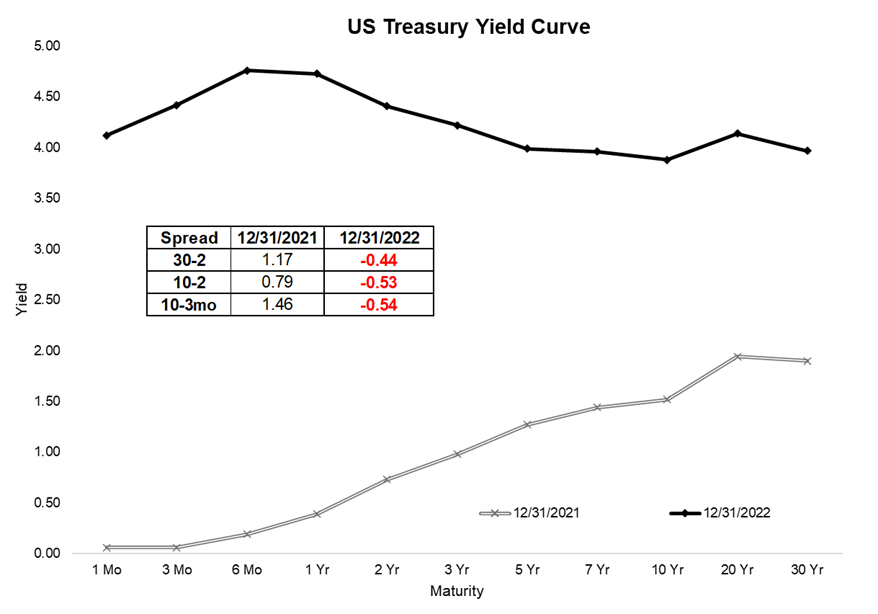
The yield curve in the US drastically shifted up and inverted (higher short-term yields than intermediate and long-term yields). The short end of the yield curve moved up to accommodate the rate hikes enacted by the Fed.11
As we stand in the early days of 2023, the lookback on 2022 is a reminder of the volatility that accompanies investing and its unavoidable nature. Risk and return go together and accepting stretches of weakness in the markets is the price of admission for long-term investors.
While the risks of last year remain largely unresolved, (primarily the risk of tighter monetary policy and its unknown effects on the economy), and cloud the near-term outlook, long-term return prospects have shown great improvement compared to this time last year.
We’ll keep in close touch on market developments in the new year and please reach out at any time to our team at Kavar with any questions or concerns.
The views expressed herein are those of John Nagle on January 13th, 2023 and are subject to change at any time based on market or other conditions, as are statements of financial market trends, which are based on current market conditions. This market commentary is a publication of Kavar Capital Partners (KCP) and is provided as a service to clients and friends of KCP solely for their own use and information. The information provided is for general informational purposes only and should not be considered an individualized recommendation of any particular security, strategy or investment product, and should not be construed as, investment, legal or tax advice. Different types of investments involve varying degrees of risk, and there can be no assurance that any specific investment or strategy will be suitable or profitable for a client’s investment portfolio. All investment strategies have the potential for profit or loss and past performance does not ensure future results. Asset allocation and diversification do not ensure or guarantee better performance and cannot eliminate the risk of investment losses. Charts and graphs presented do not represent the performance of KCP or any of its advisory clients. Historical performance results for investment indexes and/or categories, generally do not reflect the deduction of transaction and/or custodial charges or the deduction of an investment management fee, the incurrence of which would have the effect of decreasing historical performance results. There can be no assurances that a client’s portfolio will match or outperform any particular benchmark. KCP makes no warranties with regard to the information or results obtained by its use and disclaims any liability arising out of your use of, or reliance on, the information. The information is subject to change and, although based on information that KCP considers reliable, it is not guaranteed as to accuracy or completeness. This information may become outdated and KCP is not obligated to update any information or opinions contained herein. Articles herein may not necessarily reflect the investment position or the strategies of KCP. KCP is registered as an investment adviser and only transacts business in states where it is properly registered or is excluded or exempted from registration requirements. Registration as an investment adviser does not constitute an endorsement of the firm by securities regulators nor does it indicate that the adviser has attained a particular level of skill or ability.
Footnotes:
- Morningstar Direct data
- Morningstar Direct data
- JPMorgan Long-Term Capital Market Assumptions https://am.jpmorgan.com/content/dam/jpm-am-aem/global/en/insights/portfolio-insights/ltcma/ltcma-full-report.pdf
- Morningstar Direct data
- Morningstar Direct data
- Morningstar Direct data
- Morningstar Direct data
- Morningstar Direct data
- Morningstar Direct data
- St. Louis Federal Reserve – ICE BofA US High Yield Index Option-Adjusted Spread https://fred.stlouisfed.org/series/BAMLH0A0HYM2 St. Louis Federal Reserve – ICE BofA US Corporate Index Option-Adjusted Spread https://fred.stlouisfed.org/series/BAMLC0A0CM
- US Treasury https://home.treasury.gov/policy-issues/financing-the-government/interest-rate-statistics