Investment Research Note – October 5th, 2021
Third Quarter 2021 Review
The 3rd quarter of the year ended last week with the market in the midst of the first significant bout of volatility for 2021. To start this week, the market sold off some more, with the S&P 500 losing -1.30% as the Technology sector led the way down. The Tech heavy NASDAQ Composite lost -2.14%. These returns bring the peak-to-trough drawdowns for the S&P 500 to -5.21% from the prior all-time closing high on September 2nd, 2021. The drawdown is more severe for the NASDAQ, with the losses there are currently at -7.28% from the prior all-time closing high on September 7th, 2021. The market is firmly in its first correction of the year.1
As is usually the case, its difficult to pinpoint a specific cause of a market sentiment shift but a couple external factors that bring back bad memories are obvious while some other fundamental conditions may share in the blame:
Evergrande
News percolated to the mainstream over the weekend of September 18th-19th that Evergrande, the 2nd largest property developer in the world’s 2nd largest economy (with over $300 billion in debt) was in danger of missing an interest payment and beginning the default process. Many drew a parallel between Evergrande and Lehman Brother’s 2008 default as watershed moments during market crashes causing contagion to rip through the global financial system. Investors flipped to risk-off on Monday September 20th seemingly in reaction and the S&P 500 lost -1.7%, it’s worst day since May 2021.2
Evergrande had the feeling of a Black Swan type of event – one that catches investors completely off guard. Is this China’s Lehman Moment and the first domino in bringing the Chinese financial and banking system to the brink of collapse or a blip that is contained to China given its closed economy? The answer is somewhere in between but still ultimately unknown. While the global contagion concern seems to have diminished, the ripple effects to the Chinese economy are yet to be determined. The unwinding of Evergrande’s obligations, asset sales and a potential government bailout will all unfold over the coming weeks and months and it’s certainly on the market’s radar.
The Debt Ceiling
The United States Debt Ceiling debate is back and again, the market doesn’t like the idea of Congress playing political football with the ability of the US Treasury to satisfy its obligations. Investors recall in 2011 when the debate went so far that the US had its credit rating downgraded by Standard and Poor’s and the S&P 500 responded by dropping -6.66% in the next trading session.3
A default by the US, a risk-less entity, is generally unthinkable and it’s not necessary to even consider what that looks like. However, the market nervousness surrounding the debate and the non-zero chance of the debt ceiling not being raised in time is evident. The exact date of when the Treasury will exhaust all measures is a guess but it’s sometime in mid-October so the clock is ticking loudly.4
The logical outcome from all this is that the debt ceiling will be raised in time and without much more fanfare while the larger conversation around government spending can continue without upsetting the markets with a self-inflicted crisis.
Beyond these externalities, macro factors, market technicals and investor psyche all contributed to sparking the market pullback:
Macro Factors
The market continues to weigh the shifting landscape of interest rates and inflation and how they may change given the Federal Reserve’s policy path. The market generally reacted approvingly of the latest FOMC meeting in September even though the committee acknowledged it will soon begin to taper asset purchases in the first step of reining in ultra-accommodative policies.
In the days following the Fed meeting, interest rates moved up swiftly with the 10-year Treasury yield going from 1.31% on 9/20/21 to 1.55% on 9/29/215. These rate moves have, in recent history, been a catalyst for a sell-off in Growth stocks, particularly those in the Technology sector, according to the narrative that: high multiple and companies’ whose value rests in strong, long duration future cash flows are negatively impacted by rising rates.6 Given the concentration of Growth stocks at the top of the index’s weighting, the impact on the direction of the market as a whole can’t be understated.
Market Technicals
Underneath the market’s hood some deterioration was taking place before and shortly after all-time highs were registered on September 2nd. If you only looked at the headline numbers, you’d have missed market breadth indicators like the “Advance/Decline Line” and the “New Highs Minus New Lows” measure had already begun to roll over, signaling a narrowing of leadership for the index.7
Seasonality
Seasonality in the markets are typically anomalies not related to any observable fundamental underpinnings but appear to affect investor psyche as part of a feedback loop, in this case a negative one. September is often cited as being the weakest month for stock performance historically, since 1950 the average September return is -0.5% while the median monthly return is positive8. So given this knowledge anchor, investors seem more willing to head to the exits around September than other times of the calendar year.
Waiting for a Pullback
The final item ties into the investor psyche as well since the market had been on a run of positive consistency that historically doesn’t last. In any given calendar year since 1980, the market experienced an average drop of -14.3% at some point during the year9. For the first 8 months of 2021, the maximum drop for the S&P 500 was -4.13%.10 The S&P 500 was on a streak of 7 consecutive positive months.11 Anecdotally, the market seemed like it was waiting for an excuse to take risk off the table and let some air out of the market.
Pullbacks such as this, prospectively attributable to a confluence of events, conditions, and sentiment shifts, as opposed to an easily identifiable spark reinforce the understanding that markets have to go down at times in order for them to go up. The market is going through a re-rating as it sifts through the perception of elevated risks and as unenjoyable as any pullback is, corrections can be a healthy part of the longer-term positive market direction.
Market Breakdown
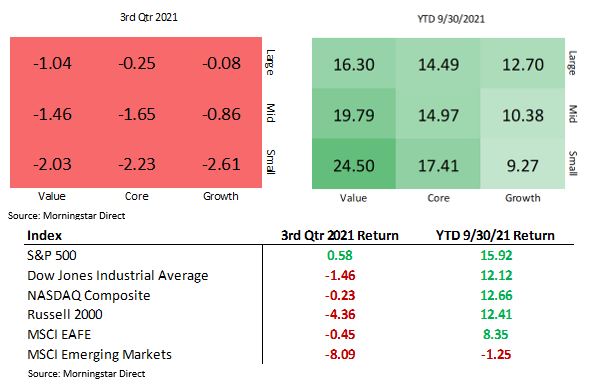
The 3rd quarter of the year will ultimately go down as a lost quarter collectively for US stocks despite hitting multiple all-time highs. The S&P 500 (+0.58%) for the quarter) eked out a minor gain alongside small losses for the Dow Jones Industrial Average (-1.46%) and NASDAQ Composite (-0.23%).12

Higher pain points were small cap stocks in the US, as represented by the Russell 2000 which finished down -4.36% and abroad in Emerging Markets, down -8.09% primarily driven by weakness in Chinese markets. Year-to-date, Value stocks continues to outperform Growth stocks and especially Small Cap Value, which has now posted a +24.50% gain year-to-date through 9/30/21, by far the best performing style box.13
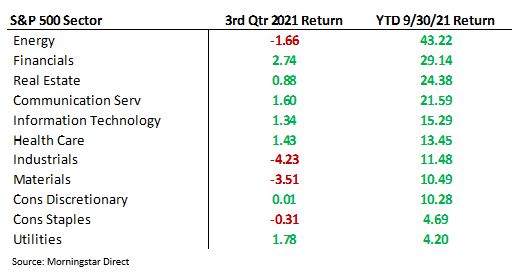
Energy, Financial and Real Estate continue to lead the way in 2021 from a sector perspective, performing as expected given the rise in commodity prices, interest rates and inflation expectations during the year. During the 3rd quarter the Energy, Materials, and Industrials sectors all posted negative returns. Financials were the best performing sector during the 3rd quarter.14

Utilities and Consumer Staples continue to be the sector laggards thus far for the year.15
Globally, the rotation out of US and into International stocks has failed to materialize over any significant stretch this year. MSCI EAFE, +8.35% for the year was essentially flat for the 3rd quarter, and the MSCI Emerging Markets index is now negative for the year, -1.25% through 9/30/21. 16
The views expressed herein are those of John Nagle on October 5th, 2021 and are subject to change at any time based on market or other conditions, as are statements of financial market trends, which are based on current market conditions. This market commentary is a publication of Kavar Capital Partners (KCP) and is provided as a service to clients and friends of KCP solely for their own use and information. The information provided is for general informational purposes only and should not be considered an individualized recommendation of any particular security, strategy or investment product, and should not be construed as, investment, legal or tax advice. Different types of investments involve varying degrees of risk, and there can be no assurance that any specific investment or strategy will be suitable or profitable for a client’s investment portfolio. All investment strategies have the potential for profit or loss and past performance does not ensure future results. Asset allocation and diversification do not ensure or guarantee better performance and cannot eliminate the risk of investment losses. Charts and graphs presented do not represent the performance of KCP or any of its advisory clients. Historical performance results for investment indexes and/or categories, generally do not reflect the deduction of transaction and/or custodial charges or the deduction of an investment management fee, the incurrence of which would have the effect of decreasing historical performance results. There can be no assurances that a client’s portfolio will match or outperform any particular benchmark. KCP makes no warranties with regard to the information or results obtained by its use and disclaims any liability arising out of your use of, or reliance on, the information. The information is subject to change and, although based on information that KCP considers reliable, it is not guaranteed as to accuracy or completeness. This information may become outdated and KCP is not obligated to update any information or opinions contained herein. Articles herein may not necessarily reflect the investment position or the strategies of KCP. KCP is registered as an investment adviser and only transacts business in states where it is properly registered or is excluded or exempted from registration requirements. Registration as an investment adviser does not constitute an endorsement of the firm by securities regulators nor does it indicate that the adviser has attained a particular level of skill or ability.
Footnotes:
- Morningstar Direct Data
- https://www.morningstar.com/articles/1059098/the-evergrande-crisis-explained-should-investors-worry
- Morningstar Direct Data
- https://www.fidelity.com/learning-center/trading-investing/2021-debt-ceiling
- US Treasury https://www.treasury.gov/resource-center/data-chart-center/interest-rates/Pages/TextView.aspx?data=yieldYear&year=2021
- https://www.bloomberg.com/news/articles/2021-10-02/big-tech-s-stock-market-leadership-is-threatened-by-rising-rates
- https://www.forbes.com/sites/tomaspray/2021/09/12/correction-evidence-builds-but-investors-not-worried-yet/?sh=68d44fdb6fd3
- https://lplresearch.com/2021/08/31/here-comes-the-worst-month-of-the-year-2/
- JPMorgan Guide to the Markets https://am.jpmorgan.com/content/dam/jpm-am-aem/americas/us/en/insights/market-insights/guide-to-the-markets/daily/protected/mi-daily-gtm-us.pdf?hash=hj6bdahdee22e
- Morningstar Direct Data
- https://lplresearch.com/2021/08/31/here-comes-the-worst-month-of-the-year-2/
- Morningstar Direct Data
- Morningstar Direct Data
- Morningstar Direct Data
- Morningstar Direct Data
- Morningstar Direct Data
