
Market Update – February 24, 2020
News over the weekend that focused on the escalation of coronavirus cases and, perhaps more concerning, the expansion of geographies across which those cases have been sited, catalyzed a significant decline in global stock markets today.
In fact, for many indices, this was the poorest single-day performance since February of 2018. The Dow Jones Industrial Average fell 1,031 points and is now lower by 2.02% year-to-date. The S&P 500 fell 111.86 points and also dropped below the flat line for 2020.1
For a market that had become quite accustomed to quiet over the last 13 months, the recent 2 weeks have shaken it from its slumber.
Since market history is one of a repeating variety, we have been on the hunt for prior periods of comparison to estimate/extrapolate the adverse impact of an epidemic such as the coronavirus.
Suffice it to say, the markings of any illness are unique, and this is not an intent to trivialize the human toll that has been, and may further be, exacted. We are purely attempting to ascertain performance patterns attendant to contextually similar circumstances.
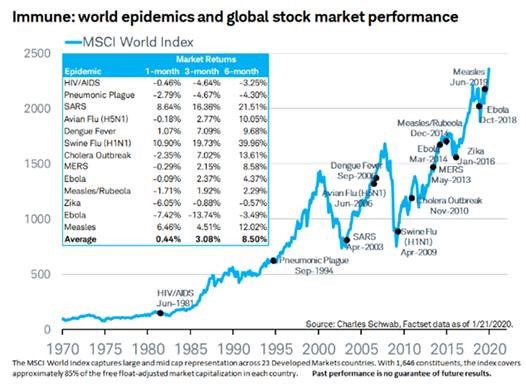
So, what can previous outbreaks tell us about moves in financial markets? Succinctly: during epidemics, stock markets are typically served a short-term selloff, which has historically been followed by a strong recovery.
The negative impact of SARS (Severe Acute Respiratory Syndrome), for example, was brief. The peak-to-trough market declines from SARS (upon the WHO encountering the virus) for the MSCI World, S&P 500, and Stoxx 600 Europe were -5.3%, -3.8%, and -11.1%, respectively. They were fast and fleeting. As the table above lays out, the selling pressure lasted only a couple weeks as the following periods of measurement were decidedly positive.
The market moves were similar for the Avian Flu (upon the WHO predicting an upsurge in casualties), with declines of 7.4%, 5.0%, and 6.0%, respectively for the same indices mentioned above. Also, like SARS, the market promptly found a firmer footing, finishing stronger in the following 3 and 6-month periods.2
Perhaps not surprisingly, there are discrepancies among the research we’ve considered as to the appropriate time horizon for measuring market moves in response to these eruptions, which is why I am offering a second point of comparison below:
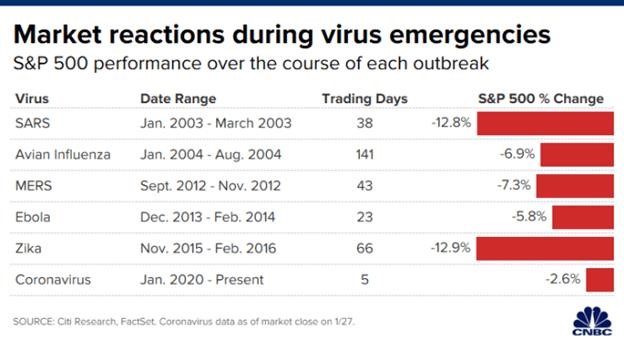
This was chart was published at the end of January and does not reflect the current level of the S&P 500. If updated thru today, the total drop in the S&P 500, if 100% of the decline were to be attributed to the coronavirus, would be 4.7%.3
This pullback has been a nuisance but again, given the relative absence of any substantive volatility throughout all of 2019, its presence probably seems more profound than a 4.7% dip.
Naturally, we have contemplated the impact on the market and the economy of the coronavirus should it end up being worse than some of the other modern epidemics. I mean, the market, by its very nature is a forward-looking mechanism which reflects the present value of its outlook in today’s prices. And it is known to climb a wall of worry – essentially fortifying itself from downside surprises – and often going past a rational resting point.
The excerpt below does a nice job capsulizing our thoughts along these lines:
One of the arguments for why markets crash during viral outbreaks is that market participants are anticipating worsening results. If coronavirus presented more of an existential crisis to humanity, wouldn’t markets have to fall further as a result?
Unfortunately, given the limited number of epidemics we have seen in modern times, we don’t have lots of data to go on. But, we do have one pandemic that fits the bill. Enter the Spanish Flu.
Unlike the other epidemics on this list, the Spanish flu was a global killer. Between 1918 and 1920, it infected over 500 million people (~27% of Earth’s population) and killed over 50 million of them.
It’s hard to imagine this many people dying considering that Ebola and Swine flu killed about 12,000 people each and SARS killed fewer than 1,000 individuals.
Overlaying this same coloring with the Dow during this time period, we can see that the market sold off about 10% shortly after the peak:
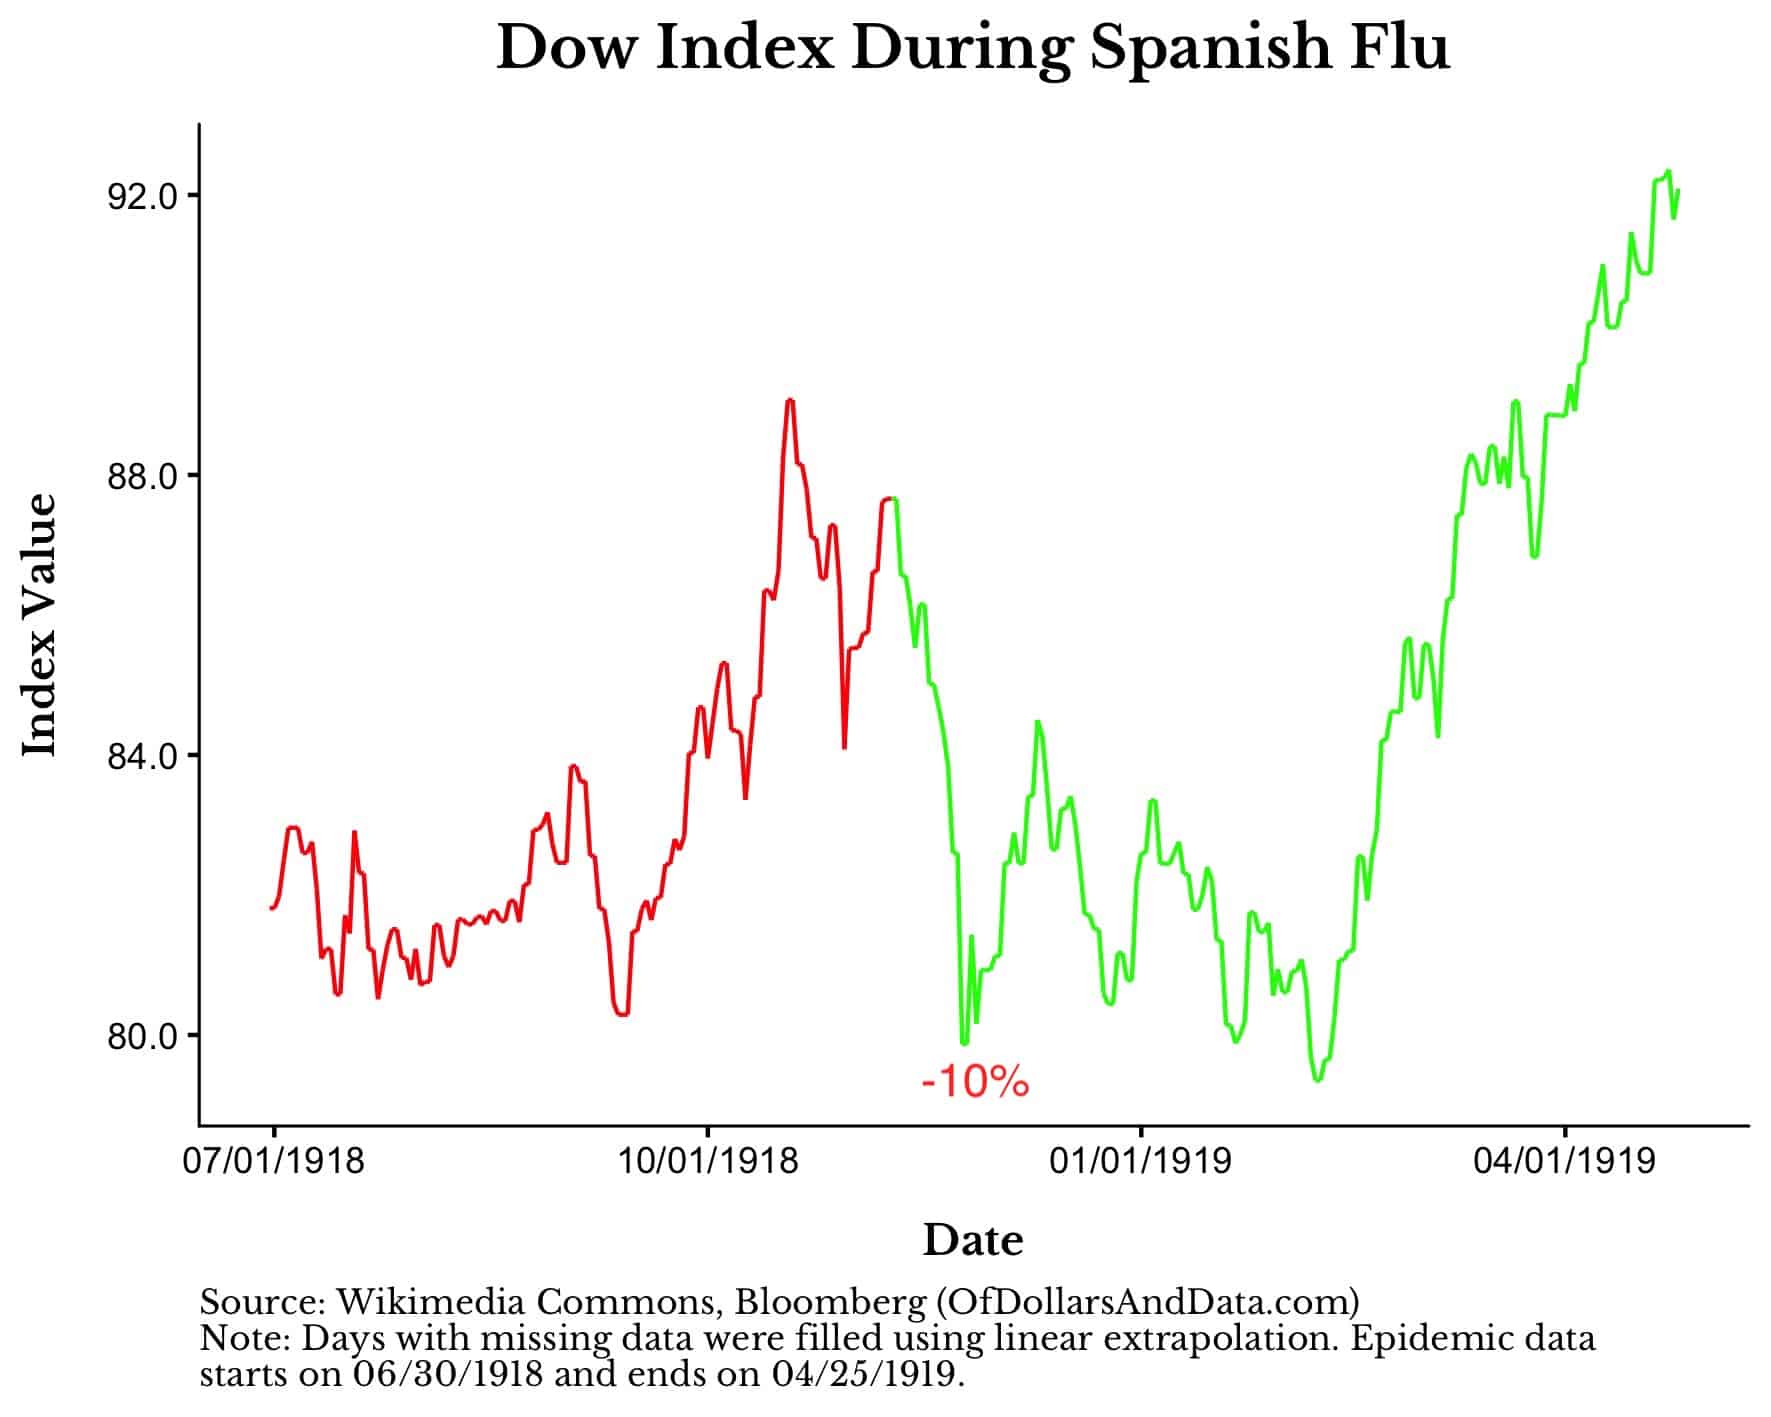
However, unlike the modern epidemics, the market stayed depressed for a few months post-peak.
This suggests that market participants thought that things could get worse. Or, it is also possible that these depressed prices had nothing to do with the Spanish flu whatsoever. We can’t know with certainty.
But think about what this tells us. A global pandemic that killed 3% of the Earth’s population only sent markets down 10% over a period of 4 months.
This is a stunning result. The worst virus since the bubonic plague and markets go through a run-of-the-mill decline? I would not have guessed that beforehand.
And it is unlikely that coronavirus will be anywhere near as catastrophic as the Spanish flu because of our greatly improved medical knowledge over the past century. However, this does not imply that the economic costs will be lower.
If anything, the economic costs of coronavirus are likely to be higher than prior epidemics as we take larger preventive measures to stop the virus from spreading. Cancelling tens of thousands of flights to the most populous country on Earth is just one example of this.
We can speculate on this in every way we want, but no one knows what will happen. If history is any guide, coronavirus is likely to cause a small, but temporary, pullback as it continues to spread.
But once things begin to improve, the market is likely to get out of its funk and recover its losses. Another crisis will be averted and humanity will march on.
Source: https://ofdollarsanddata.com/how-will-coronavirus-affect-your-portfolio/
OK, I know what you may be thinking…..The Spanish Flu?! Isn’t that a bit of a stretch? Especially given how much has changed in markets, economies, information dissemination, investor participation, financial product evolution, hedging strategies, etc?
Well, if emotion were ever calibrated efficiently, consistently or rationally, then I may fail to see the information in the comparison. However, when sell-off’s take hold they seem substantiated until they are satiated.
If anything, the sophistication of the modern market could assist in diminishing the full thrust of any cathartic or cataclysmic decline.
Along those lines, I’ll wrap up with an anecdotal offering from the Bespoke Research boutique that was published this am:
It’s hard to find positives on a day when the S&P 500 is down 3.5%, but we’ve at least got some notable stats that are quite bullish for returns going forward.
If the S&P 500 were to close at current levels, today’s 3.55% decline would be the 48th biggest one-day drop since SPY began trading in 1993.
Today’s drop is also the biggest Monday decline since February 5th, 2018 when SPY fell 4.18%.
As shown below, 2%+ drops on Mondays have historically been bought with a vengeance in the near term. Since March 2009, there have been 18 prior 2%+ drops on Mondays, and SPY has seen an average gain of 1.02% on the next day (Turnaround Tuesday). Even more impressive, over the next week, SPY has averaged a huge gain of 3.16% with positive returns 17 out of 18 times. And over the next month, SPY has averaged a gain of 6.08% with positive returns 17 of 18 times as well!
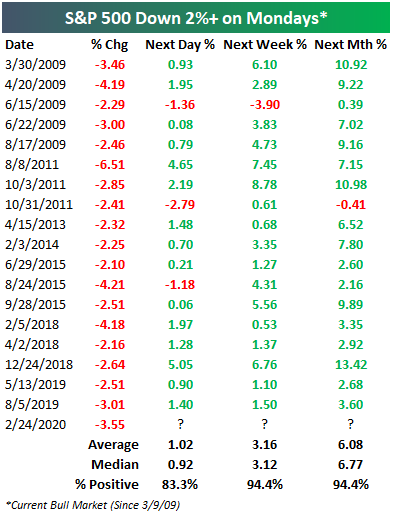
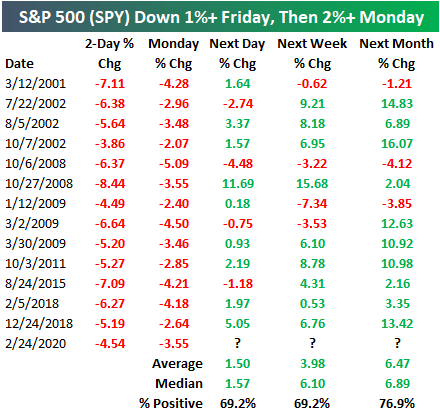
Remember, SPY also fell 1%+ last Friday, resulting in a two-day drop of 4.54%. Since SPY began trading in 1993, there have only been 13 instances in which Friday fell 1%+ and the following Monday fell 2%+. These instances are listed in the table below. The last time it happened was back in late December 2018, and that Monday (Christmas Eve) marked the low of the Q4 2018 selloff. The following trading day saw SPY gain 5.05%, and it went on to rally 6.76% over the next week and 13.42% over the next month.
Overall, when SPY has fallen 1%+ on Friday and 2%+ the following Monday, the ETF has averaged a gain of 1.5% on the next trading day, a gain of 3.98% over the next week, and a gain of 6.47% over the next month. The median gains over the next day, week, and month are even stronger.
Balancing a portfolio consistent with your time horizon and intestinal fortitude is the key to navigating incidences of this type which do periodically pop-up.
All too often, there is a temptation to allow short-term influences to alter strategic, long-term objectives. Resisting that temptation is critical to obtaining investment success.
We’ll keep in close touch as we move thru this latest bout of market volatility and we’ll keep those stricken with the coronavirus in our prayers.
Please reach out to any of the Kavar team members with questions as to any specific implications for your personal portfolios.
1 Source: Bloomberg Market Data
2 https://www.man.com/maninstitute/views-from-the-floor-2020-feb-04
3 Source: Bloomberg Market Data
The views expressed herein are those of Doug Ciocca on February 24, 2020 and are subject to change at any time based on market or other conditions, as are statements of financial market trends, which are based on current market conditions. This market commentary is a publication of Kavar Capital Partners, LLC (KCP) and is provided as a service to clients and friends of KCP solely for their own use and information. The information provided is for general informational purposes only and should not be considered an individualized recommendation of any particular security, strategy or investment product, and should not be construed as, investment, legal or tax advice. Different types of investments involve varying degrees of risk, and there can be no assurance that any specific investment or strategy will be suitable or profitable for a client’s investment portfolio. All investment strategies have the potential for profit or loss and past performance does not ensure future results. Asset allocation and diversification do not ensure or guarantee better performance and cannot eliminate the risk of investment losses. Charts and graphs presented do not represent the performance of KCP or any of its advisory clients. Historical performance results for investment indexes and/or categories, generally do not reflect the deduction of transaction and/or custodial charges or the deduction of an investment management fee, the incurrence of which would have the effect of decreasing historical performance results. There can be no assurances that a client’s portfolio will match or outperform any particular benchmark. KCP makes no warranties with regard to the information or results obtained by its use and disclaims any liability arising out of your use of, or reliance on, the information. The information is subject to change and, although based on information that KCP considers reliable, it is not guaranteed as to accuracy or completeness. This information may become outdated and KCP is not obligated to update any information or opinions contained herein. Articles herein may not necessarily reflect the investment position or the strategies of KCP. KCP is registered as an investment adviser and only transacts business in states where it is properly registered or is excluded or exempted from registration requirements. Registration as an investment adviser does not constitute an endorsement of the firm by securities regulators nor does it indicate that the adviser has attained a particular level of skill or ability.