
Market Update – February 27, 2020
When I sent out the market recap on Monday evening, I closed on an optimistic tone, siting the probabilistic tendency of the S&P 500 to stage a recovery after a day of significant selling. That did not happen.
Each day this week, the Dow Jones Industrial Average and the S&P 500 have continued lower. The selling has been unrelenting and today it was indiscriminate.
What I mean by that is: little, if any, concern was given to fundamentals, characteristics or valuations of common stocks. The pure fact that a common stock is a common stock qualified it to be sold.
All 3 major US indices (those mentioned above in addition to the Nasdaq) are now in “correction” territory. A “correction” is a decline of 10% or more from recent highs.
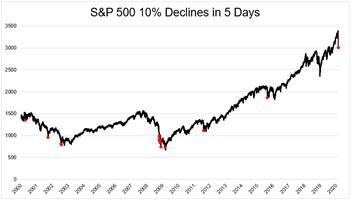
Amazingly, today marked the fastest 10% decline from an all-time high in the S&P 500’s history.
In fact, in the last 20 years, the S&P 500 has dropped more than 10% in 5 days only a handful of times1:
-Chinese Yuan Currency Devaluation (2015)
-Eurozone/PIIGS crisis (2011)
-Global Financial Crisis (’08/’09)
-Dotcom bubble bursting (’00,’01,’02)
 Source: Morningstar
I point these out solely to demonstrate the infrequency and unpredictability of such moves. While incredibly clear in hindsight, the rarity of such occurrences renders it strategically suboptimal to structure an allocation around/to avoid them.
Peter Lynch said it most eloquently, “More people have lost more money anticipating corrections than in the actual corrections themselves.”
I know it does not feel like that today.
On the flip side, the 10-year bond yield hit a record low yield today: 1.26%.
Yes, you can lend your money to the US Government to receive a fixed rate of interest….for 10 years….of 1.26%. This is a clear manifestation of the fear in markets right now.
The source of that fear, obviously, is the coronavirus.
I’ll spare you a recitation on the epidemiology. I’m not qualified.
But I will share some interesting data that has been made available from its epicenter:
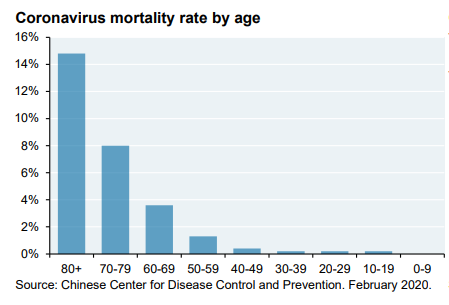
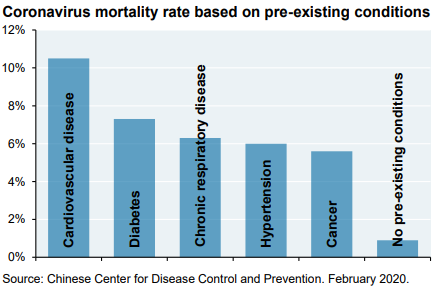
Please understand that the presentation of this data is not in any way intended to minimize the importance of even a single casualty from this virus. It is to demonstrate that the susceptibility to its maximum adverse impact is likely less than being portrayed by the media.
All of these charts focus on China. Understandably. But does the oddity of this net table surprise you as much as it shocked me??2
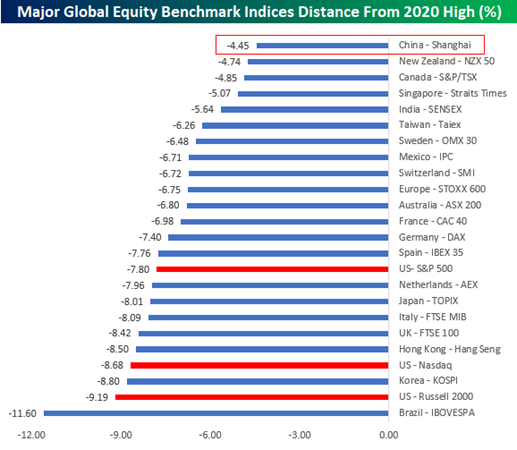
China is closer to its year-to-date high than any other global equity benchmark! And this does not include Thursday’s trading action. We mentioned how weak the US closed, but China closed higher, further extending its relative outperformance.
Perhaps it is headlines/comments such as this – both from today:
Starbucks Reopens Stores in China – Bloomberg News
“With the number of new cases in China slowing, we are seeing the early signs of a recovery in the region,” Mr. Kevin Johnson, Starbucks CEO said in a letter Thursday.
Or….
*APPLE’S CEO SAYS CHINA GETTING CORONAVIRUS UNDER CONTROL: FOX
*APPLE’S TIM COOK SAYS SOME CHINA SUPPLIERS REOPENING FACTORIES: FOX
Companies and governments are treating the prospects of outbreaks in their countries with an abundance of caution and I think that is responsible.
Fear is a natural coping mechanism when dealing with unknowns and I do think the media is predisposed to peddling fear as it captivates viewers/readers.
Fear also leads investors to seek safety as mentioned above and that has exacerbated the selling pressure on the stock market.
The stock market has hurriedly embedded a major economic headwind from the coronavirus. Such a headwind could slow corporate profit growth and prompt a recalibration of expected returns. When taken in consideration of the recently attained record highs, the downside fuel gets fired.
The market essentially shrouds itself in a coat of protection – pulling forward a worst-case scenario and expressing relief when it is forestalled. (A move higher from an “over-sold” market condition is known as a “relief rally”).
As difficult it is to digest the last week of trading action, I believe we are making our way toward a bottom. The market is getting very washed out as points of comparison indicate below:
S&P 500: 7% of stocks closed above their 50-day moving avg today, lower than 98% of historical data back to Dec ’01.
Other periods in extreme oversold zone (bottom 2% of readings)…
- July-Aug ’02
- Aug ’07
- Jan ’08
- Oct-Dec ’08
- March ’09
- May-Jul ’10
- Aug ’11
- Aug-Sep ’15
- Dec 2018-Jan ’19
All prior-period lows
Source: https://twitter.com/charliebilello/status/1233209701967462401?s=12
Along these lines, the media exchange of the week took place yesterday between Sara Eisen and Mike Santoli, both of CNBC. Mike suggested that the market is finding a bottom soon. Sara objected on the grounds that the coronavirus had not been “figured out” yet. Mike replied, “You know, the market eventually turned around after 911 and I’m pretty sure we still haven’t figured terrorism out yet.”
Not unlike 911, the world markets are bracing themselves for the maximum economic disruption from the virus, even leading some to call for a recession. I think that this is way too premature……too little is known, and speculation does not itself drive an economy to contract.
Which leads me to the second to last point of this note: I think that the Fed is going to cut interest rates, and soon. While they do not formally meet again until March 18th, I think there is a chance that they could announce a rate cut ahead of the meeting.
The goal with a rate cut is to add stimulus to an economy that is sagging/lagging. It does not cure the coronavirus and it does not change paranoia into pleasure. What cutting rates does is reduce the cost of capital to allow businesses to function more efficiently and profitably. It reduces capital expenditures and offers opportunities to perpetuate the important aspects of doing business: employing people and selling products/services.
The Fed wants to keep the economy growing. If the coronavirus inhibits such growth, look for the Fed to step in.
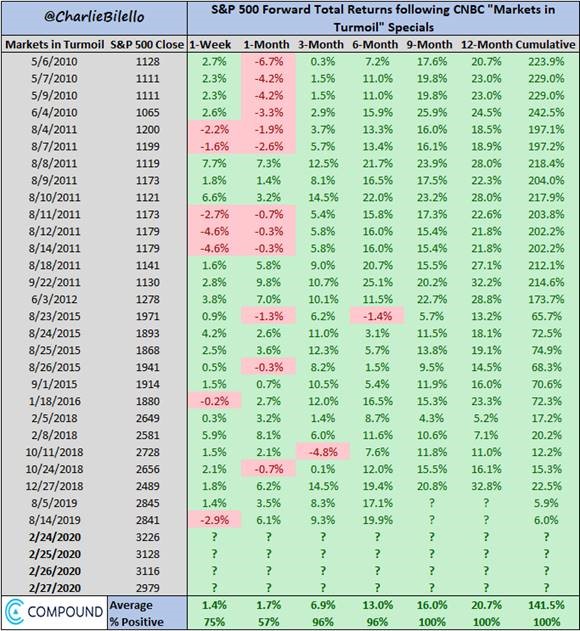
Lastly, I thought this table below was fascinating. CNBC runs a segment known as, “The Markets in Turmoil” when volatility elevates and fear predominates. It has become a reliable contrarian indicator for future market activity and the results that support that statement are below for the last 10 years.
Every time that they have run this segment in the last 10 years, the market has been higher 9 and 12 months later…..here’s hoping that mean reversion holds!
Source: https://twitter.com/charliebilello/status/1233184314197716998/photo/1
We’ll keep in close touch as we move thru these tenuous times. dc
1 Source: Morningstar Market Data
2 Source: Bespoke Investment Group
The views expressed herein are those of Doug Ciocca on February 27, 2020 and are subject to change at any time based on market or other conditions, as are statements of financial market trends, which are based on current market conditions. This market commentary is a publication of Kavar Capital Partners, LLC (KCP) and is provided as a service to clients and friends of KCP solely for their own use and information. The information provided is for general informational purposes only and should not be considered an individualized recommendation of any particular security, strategy or investment product, and should not be construed as, investment, legal or tax advice. Different types of investments involve varying degrees of risk, and there can be no assurance that any specific investment or strategy will be suitable or profitable for a client’s investment portfolio. All investment strategies have the potential for profit or loss and past performance does not ensure future results. Asset allocation and diversification do not ensure or guarantee better performance and cannot eliminate the risk of investment losses. Charts and graphs presented do not represent the performance of KCP or any of its advisory clients. Historical performance results for investment indexes and/or categories, generally do not reflect the deduction of transaction and/or custodial charges or the deduction of an investment management fee, the incurrence of which would have the effect of decreasing historical performance results. There can be no assurances that a client’s portfolio will match or outperform any particular benchmark. KCP makes no warranties with regard to the information or results obtained by its use and disclaims any liability arising out of your use of, or reliance on, the information. The information is subject to change and, although based on information that KCP considers reliable, it is not guaranteed as to accuracy or completeness. This information may become outdated and KCP is not obligated to update any information or opinions contained herein. Articles herein may not necessarily reflect the investment position or the strategies of KCP. KCP is registered as an investment adviser and only transacts business in states where it is properly registered or is excluded or exempted from registration requirements. Registration as an investment adviser does not constitute an endorsement of the firm by securities regulators nor does it indicate that the adviser has attained a particular level of skill or ability.