Market Update – November 20, 2018
In this beloved week of giving thanks, the financial markets are doing the opposite: taking….and rather ungratefully!
The major market averages have fallen pretty hard the first 2 days of this holiday-shortened week, leaving the Dow Jones Industrial Average (9% from its near-term highs) & the S&P 500 (also 9% from its near-term highs) in negative territory for the year. The Nasdaq Composite, which has dropped almost 5% in the last 2 days, is clinging to a gain of 0.08% for 2018 and is 15% off its near-term highs1.
November initially offered some reprieve from the tough market month of October but has failed to sustain any calming qualities.
To be fair, many areas of the market had been listless-to-poor performers well before the last couple of months, as the sole bastion of global asset-class positivity had existed in US stocks of the “growth” variety.
The chart below, tho a bit outdated, underscores this point:
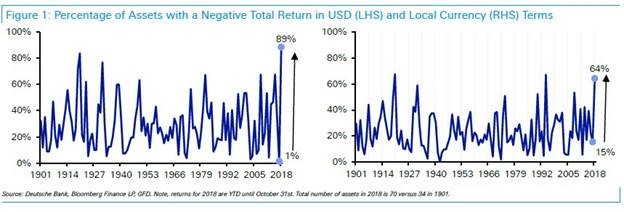
This chart from Duetsche Bank (left-hand side) offers some insight as to the comprehensive nature of this year’s declines. Fascinating by its comparison to 2017, the fact that 89% of asset classes have fallen this year thru 10/ 31 vs. only 1% of asset classes last year is striking!
Charts like the one above have prompted headlines like those below:
· You may be surprised at how many S&P 500 stocks have fallen at least 50% from record highs – Market Watch, 10/17/18
· Inside S&P 500, most stocks in correction or bear market – Reuters, 10/23/18
· Worst Day of an Awful Year Leaves No Corner of Market Unscathed – Bloomberg, 11/20/18
(this is actually a very interesting article if interested:
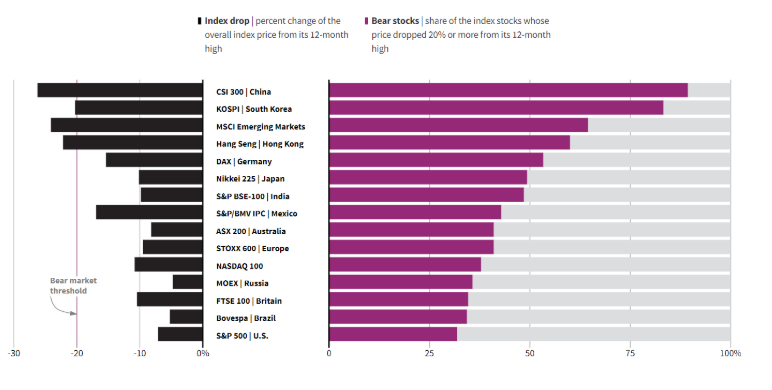
Morgan Stanley compares the US market (S&P 500) performance metrics with those of its’ foreign counterparts and demonstrates our relative resilience. But given the intertwined nature of the global financial system, there may have just been too much pressure to sustain our gains.
For those of you who regularly read the Market Updates, the inescapable themes of each – due in large part because they are only written when the market misbehaves – are: perspective and patience.
Neither perspective or patience is intended to override investor/client instincts or intestinal fortitude. These markets are nuts of late and should the wild price swings augur for an audible to your investment plan, then we want to discuss that as well as its implications.
The reason that perspective and patience are so important is that they offer a critical context for allocating assets. They invoke the lessons of history and they establish expectations. They also provide companionship – silly as that sounds – in the form of a familiar framework within which risk and reward reside.
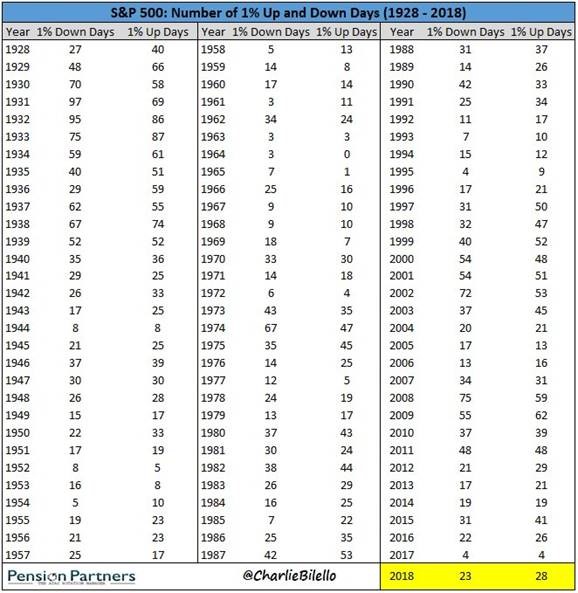
For example, this table provides 90 years of data re: the frequency of intra-day S&P 500 price gyrations of +/- 1%:
The take-away: the current level of large market moves is not an outlier to history. In fact, it is closer to the norm.
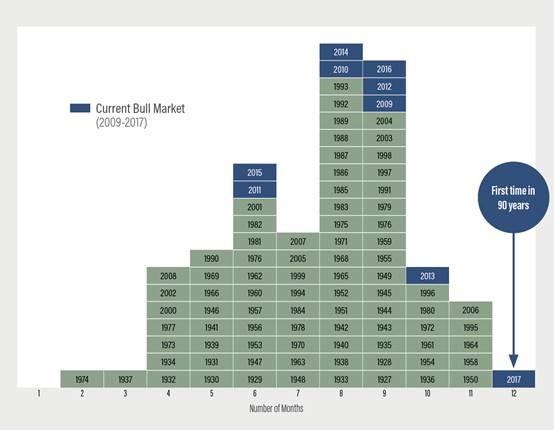
Intriguingly, over the same 90-year time horizon, 2017 was the only year in history when the Dow Jones Industrial Average went up in each month of the year:
Source: FactSet, S&P Dow Jones Indices
In many respects, what was always the norm, volatility, had quickly become the exception. That has reverted to the mean this year and I think that is a positive. Too little volatility leads to over-confidence, which can be a fatal flaw in allocating capital.
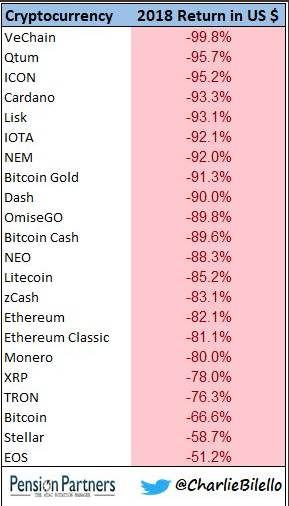
As an example, when was the last time someone pontificated to you on the virtues of crypto-currency? I don’t recall how many conversations I had in 2017 about how Bitcoin stocks and their brethren were going to change the landscape of investing – but it was a lot. And while I’m not ignorant to the fact that some sub-set of this innovative fintech may influence industry, it was a lot more plausible when the market was boringly setting records with regularity….when everything was going up.
This year has been quite a bit different:
There are many causes of the market’s whiplash-inducing moves of late: higher interest rates, a slowing global economy (maybe), trade tariffs (maybe), legislative gridlock, profit-margins peaking (maybe) and corporate debt-level concerns. The market is doing its best to front-run the adverse impact of any/all of these.
But I want to suggest that the volatility and the positive correlations among the moves of many countries (see below) is potentially a good thing.
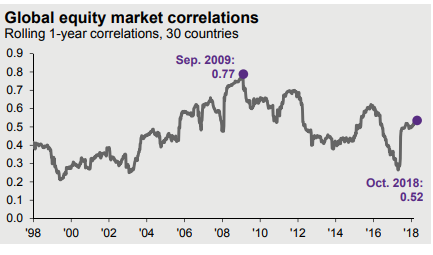
Source: JP Morgan Guide to the Markets
Invariably when the market doesn’t differentiate between good and bad companies and treats all as “bad stocks”, there becomes a valuation disparity that can be exploited. For the selectively patient investor, this may be such an opportunity.
And an additional positive aspect at this point of the swinging volatility pendulum is that both stocks and bonds have fallen in 2018 (part of the 89% of fallen asset classes are fixed income investments and as I mentioned above, part of the market’s manic mood is attributable to higher interest rates) offering entry points or reallocation options that can equally accentuate growth and income.
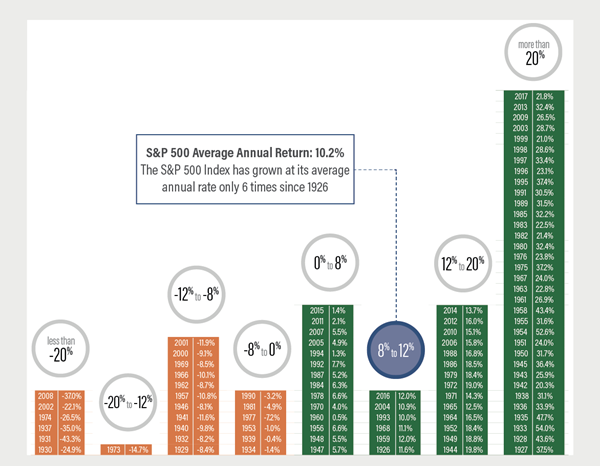
I’ll close with one last “perspective” piece below that identifies the very commonly lumpy attributions of historical returns to comprise the market’s average return. Last year was fantastic and this year is far more challenging. Like with most things, the only constant with investing is change. The key is commitment to our objectives and the patience and perspective to achieve or to alter them.
Best wishes to you and your family for a blessed Thanksgiving holiday! And thanks so much for your trust in Kavar Capital Partners.
Source: FactSet, S&P Dow Jones Indices. Data calculated from 1926-2017 using total return.
1 Source: Bloomberg Market Data
The views expressed herein are those of Doug Ciocca on November 20, 2018 and are subject to change at any time based on market or other conditions, as are statements of financial market trends, which are based on current market conditions. This information is provided as a service to clients and friends of Kavar Capital Partners, LLC solely for their own use and information. The information provided is for general informational purposes only and should not be considered an individualized recommendation of any particular security, strategy or investment product, and should not be construed as, investment, legal or tax advice. Past performance does not ensure future results. Kavar Capital Partners, LLC makes no warranties with regard to the information or results obtained by its use and disclaims any liability arising out of your use of, or reliance on, the information. The information is subject to change and, although based on information that Kavar Capital Partners, LLC considers reliable, it is not guaranteed as to accuracy or completeness. This information may become outdated and we are not obligated to update any information or opinions contained herein. Articles may not necessarily reflect the investment position or the strategies of our firm.


