
Market Update – Q2 2017 Investment Research Newsletter
US Stocks continued to exhibit strength during the 2nd quarter, finishing the first half of the year with solid positive returns for three major barometers, the S&P 500, the NASDAQ Composite and the Dow Jones Industrial Average. The S&P 500 closed at 2,423.41 on June 30th, for total returns of +3.1% for the 2nd quarter. Developed and Emerging Markets International indices outperformed the US for the quarter, returning +6.1% and +6.3%, respectively.1
US stocks began the 2nd quarter led by continued momentum in the oft-mentioned Technology sector, however this trend slightly faded and in June a rotation to less growth-oriented sectors appeared with a rally in Financials, Healthcare and Energy stocks. Earnings season revealed growth for corporate profits in the 1st quarter of 2017. The S&P 500 showed earnings growth of +13.9% compared to the 1st quarter of 2016. After several quarters of declining earnings growth, a return to increasing profits contributed to the fundamental case for stocks. Wall Street consensus shows a continuation of top and bottom line growth for US stocks for 2017 with estimates for Earnings Growth at +6.6% for the 2nd quarter and +9.8% for the calendar year 2017.2 For the quarter, Growth stocks outpaced Value stocks,, as represented by the Russell 3000 Growth and Russell 3000 Value indices respectively, by over 3% and now lead for the year by over 9%3 (see Figure 1).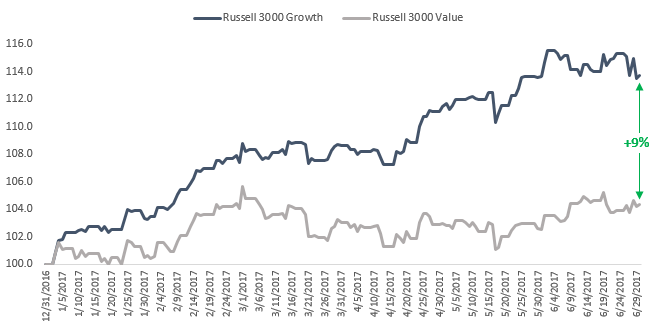 Figure 1. Source: Morningstar Direct, total returns as of 6/30/17
Equity markets have been exceptionally calm during the first half as historically low volatility was observed. The Dow Jones Industrial Average and the S&P 500 Index enjoyed a streak of 110 straight trading days without a 1% decline which finally came to an end on March 21st, 20174. It’s almost ironic how the tepid stock market has seemed to incite further nervousness and pessimism amongst investors.
All-time Highs and Bull Markets:
Major US Stock indices have hit multiple ”all-time highs” during the year, including the headline grabbing 20,000 point mark for the Dow Jones Industrial Average (DJIA), struck on January 25th, 2017. As markets continue to hit new peaks, making their most recent highs this June, it begs the question from investors of what to expect from a market that’s hitting unseen levels. New highs tend to induce fear amongst the media and investors of a looming pullback, however, the research shows that these records are typically followed by higher records (see Figure 2). So called “Animal Spirits” are sparked around all-time highs as investors fear missing out on market gains.
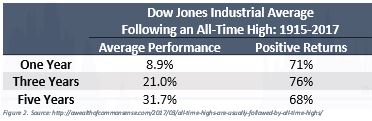
Figure 2. Source: http://awealthofcommonsense.com/2017/03/all-time-highs-are-usually-followed-by-all-time-highs/
Also of note, March 9th, 2017 stocks marked the 8th anniversary of the current equity bull market, which of course, invoked the popular narrative of the current run off the lows of the Financial Crisis as being “long in the tooth.” It’s all semantics, but some would propose this is incorrect and that the current bull market is not in its 8th year but its 4th and it started on March 6th, 2013 (see Figure 3). This is the date the market crossed both peaks made in 2000 and 2007 marking the full recovery from a secular bear market (2000-13) and the inception of the latest secular bull market (2013-present). It’s an interesting argument, as the Dot Com Bubble and the Financial Crisis created an abnormally poor period, in fact the only negative 10-year periods, for stocks from 2000 to 2013 based on rolling returns. A breakout to a new bull market would mean the run is not really that “long in the tooth” and 2009-13 was more of a recovery than a bull market rally (see Figure 4).
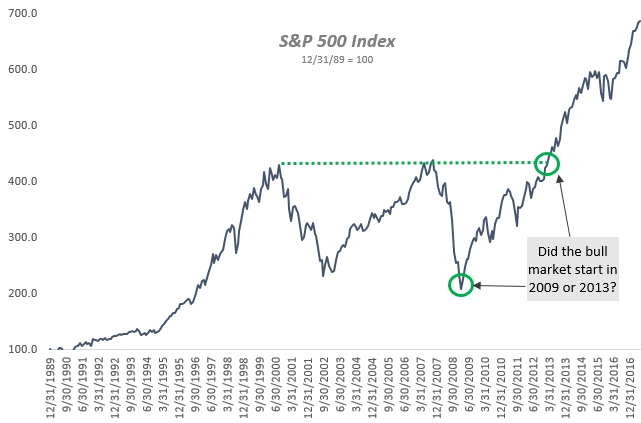
Figure 3. Source: Morningstar Direct, price level index 12/31/89-6/30/17
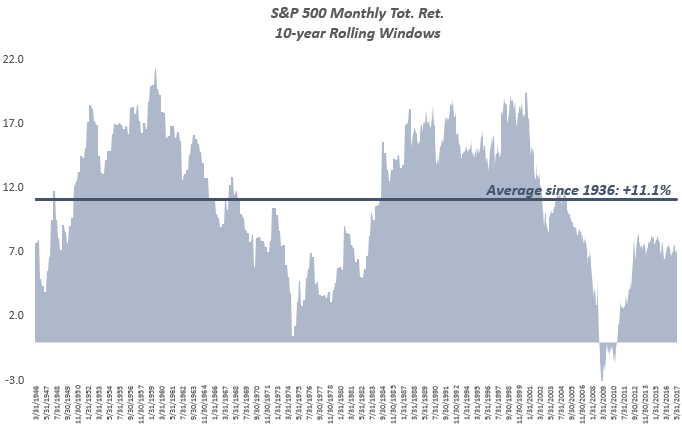
Figure 4. Source: Morningstar Direct, rolling 10-year total returns, 12/31/1946-6/30/2017
Valuations:
Negative investor sentiment is partially driven by the valuations of the markets today. It is true that relative to history we are in overvalued territory. The S&P 500 Price-to-Earnings ratio is at 21.3x on a trailing basis and 17.5x on a forward basis – both of these are above historical averages5. And it is against a popular investing idiom to say “this time is different,” but we’re considering several developments that make a case to ease nervousness around valuations.
For one, we’re still in an unprecedented interest rate environment despite the Fed’s recent hikes – which means an unprecedented discount rate or cost of capital for companies and investors to interpret opportunities. This is a powerful incentive to own equity cash flows through stocks vs. fixed income; when there’s more buyers of stocks than sellers, prices rise and valuation multiples expand.
And for another, due to the shifting make-up of our economy, the comparison of stock indices today to even 20 years ago – much less 80 years ago – isn’t an apples to apples comparison. Today the economy (and subsequently stocks) is heavily driven by the consumer and the service industry and by sectors like Technology and Healthcare. Today, the Technology sector is 22% of the S&P 5006 and for good reason; think about how much we use Technology today vs. the past. These areas of the economy today are more efficient, higher growth, less capital intensive businesses that could theoretically lend themselves to premium valuations vs. the low growth, mature industries that used to dominate the economy. The excerpt below from Ben Carlson in a recently published Bloomberg Article titled “This Time Really Is Different”7 encapsulates some of these major differences:
The composition of the corporate world and financial market structure are also completely different today. Consider the following:
- In 1957, the S&P 500 consisted of 425 industrial stocks, 60 utilities and 15 railroads. Financial stocks were not added to the index until the 1970s. Until 1988, the composition of the S&P 500 was 400 industrial stocks, 40 utilities, 40 financials and 20 transportation stocks.
- In 1902, America’s largest company, U.S. Steel, employed almost 170,000 people with sales of $561 million or $3,340 of sales per employee ($90,000 in today’s dollars). Today, Facebook generates $2 million in revenue per employee.
It’s important to interpret valuations in the mosaic of the entire market along with many other factors.
Economy:
The economic recovery since the most recent recession has been sluggish. The US has been mired in low growth, averaging just 2.1% during the current expansion, well below the 2.8% historical average8. However, slow growth is better than no growth and the US is accelerating year-over-year as of the latest observations. Forecasters believe economic growth is accelerating from its low base: The Atlanta Fed is forecasting 2.7%9 growth for the 2nd Quarter of 2017 and independent research firm Hedgeye sees GDP growth above 3% soon10. PMI and ISM readings remain in expansion territory and have surprised to the upside lately reflecting positive trends on the manufacturing front.11
The economic expansion is also seemingly entering its latter days based on historical expansion lengths; however, the strength of the current economy’s growth is significantly less than prior expansions (see Figure 5). It’s difficult to pinpoint excesses in the economy that would drive it quickly into recession at this point. As the old adage goes, economic expansions do not die of old age.
The Fed has raised rates four times now in the current cycle and projects to continue the gradual tightening pace as well as reduction of its balance sheet in the coming quarters. Inflation remains the hang up as the labor market appears strong and healthy. It remains to be seen how the Fed will go about its policy action as inflation remains below its stated target.
As rates for short-term maturing bonds have ticked up the yield curve flattened during the 2nd quarter. The 10-year yield dropped from 2.40% on 3/31/17 to a low of 2.04% on 6/27/17 before bouncing back to 2.14% by the end of the quarter. All the while, the 2- year Treasury yield rose from 1.27% to 1.38% during the 2nd quarter.12 A flattening curve can be concerning for investors as its typically a signal the bond market does not believe in future growth. However, this flattening appears to be inflation related, as expected inflation over time has come down in lockstep with longer yields. This doesn’t necessarily make the flattening a harbinger of a worsening economic growth outlook.
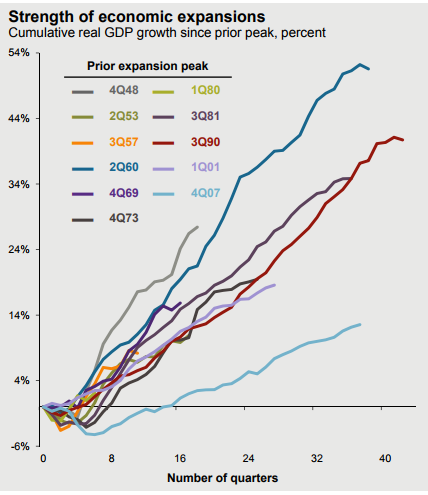
Figure 5. Source: JPMorgan Guide to the Markets as of 6/30/17
Footnotes:
- Morningstar Direct data
- FactSet Earnings Insight (https://insight.factset.com/hubfs/Resources%20Section/Research%20Desk/Earnings%20Insight/EarningsInsight_070717.pdf)
- Morningstar Direct data
- MarketWatch (http://www.marketwatch.com/story/sp-500-dow-on-verge-of-snapping-109-day-streak-without-1-tumble-2017-03-21)
- JPMorgan Guide to the Markets as of 6/30/17 (https://am.jpmorgan.com/blob-gim/1383407651970/83456/MI-GTM_3Q17_Linked.pdf?_
- JPMorgan Guide to the Markets as of 6/30/17 (https://am.jpmorgan.com/blob-gim/1383407651970/83456/MI-GTM_3Q17_Linked.pdf?_
- Bloomberg (https://www.bloomberg.com/view/articles/2017-06-26/this-time-really-is-different)
- JPMorgan Guide to the Markets as of 6/30/17 (https://am.jpmorgan.com/blob-gim/1383407651970/83456/MI-GTM_3Q17_Linked.pdf?_
- Atlanta Fed GDPNow Forecast (https://www.frbatlanta.org/cqer/research/gdpnow.aspx)
- Hedgeye Risk Management: https://app.hedgeye.com/insights/60342-hedgeye-101-here-s-why-the-u-s-economy-is-accelerating?type=macro
- JPMorgan Guide to the Markets as of 6/30/17 (https://am.jpmorgan.com/blob-gim/1383407651970/83456/MI-GTM_3Q17_Linked.pdf?_
- US Treasury (https://www.treasury.gov/resource-center/data-chart-center/interest-rates/Pages/TextView.aspx?data=yield)
Important Disclosures:
The views expressed herein are those of John Nagle on July 7, 2017 and are subject to change at any time based on market or other conditions, as are statements of financial market trends, which are based on current market conditions. This information is provided as a service to clients and friends of Kavar Capital Partners, LLC solely for their own use and information. The information provided is for general informational purposes only and should not be considered an individualized recommendation of any particular security, strategy or investment product, and should not be construed as, investment, legal or tax advice. Past performance does not ensure future results. Kavar Capital Partners, LLC makes no warranties with regard to the information or results obtained by its use and disclaims any liability arising out of your use of, or reliance on, the information. The information is subject to change and, although based on information that Kavar Capital Partners, LLC considers reliable, it is not guaranteed as to accuracy or completeness. This information may become outdated and we are not obligated to update any information or opinions contained herein. Articles may not necessarily reflect the investment position or the strategies of our firm.