
Market Update – Q3 2017 Investment Research Newsletter
If you were to size up the first three quarters of 2017 on news headlines alone, it would likely be considered one of the wildest rides on record……while in actuality it has been one of the dullest years EVER for the financial markets. The story of this year’s market has been that there’s no story – the stock market has calmly moved upwards without a major dislocating event and bond yields have barely budged. Credit spreads have narrowed to pre- Financial Crisis depths and volatility measures are near historic lows. Investors are shrugging off non-market headlines and appear to be focusing on the fundamental positives underlying equities. – valuations and current rally-length aside. Look no further than the latest cover from The Economist to get a gist of the sentiment in the market: “The bull market in everything: Are asset prices too high?” The calls for market tops, popping bubbles and cathartic corrections remain plentiful and hyperbolic. Yet, investors continue to favor stocks as profits rise and the economy remains on solid ground, reminding us that as important as it is to avoid exuberance and complacency in building an investment plan, it’s equally important to sift through the noise, be skeptical and evaluate the real fundamentals at play.

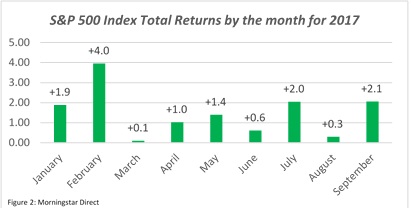
The 3rd Quarter was another good one for equity markets. Stocks moved higher as consistently as they have all year with only two negative weeks in the entire quarter. The S&P 500 index returned +4.5% for the three months ending September. Each month this year has ended with positive total returns for the S&P 5001. So far in 2017 the max drawdown for the S&P 500 has been -2.8% which would mark the smallest max drawdown for a calendar year since 19262. A statistic like that reinforces how little volatility has been observed in the markets this year – there really hasn’t been a significant market hiccup since the beginning of 2016.
Sector leadership began to rotate slightly at the end of the quarter, which is a good sign for the breadth of the market’s success. September saw a sharp rebound for this year’s lagging sectors of Financials and Energy. Growth continues to outperform Value for the year by a wide margin – led by the Technology and Healthcare sectors. Year-to-date through 9/30/17 the Russell 3000 Growth Index has returned +20.4% vs. +7.7% for the Russell 3000 Value Index3.
Small cap stocks had a huge rally in September with the Russell 2000 Index returning +6.2% for the month, led by Financials, particularly Regional Banks, which are well represented in the Index. The Russell 2000 is now at +10.9% for the year through 9/30/17. This move up partially closed the wide gap Large cap stocks had established during the first half of the year4.
Diversification outside of US markets has added value for the first time in several years as the International Developed and Emerging Markets indices have bested their US counterparts. Through 9/30/17 Developed and Emerging International Markets are up +19.9% and +27.2% respectively. The US dollar has depreciated against the trade-weighted basket of foreign currencies for the year benefitting allocators to International asset classes5.
Looking ahead:
The final Earnings Season of 2017 is upon investors and is expected to show sales and profit line growth, year-over-year, for the fifth consecutive quarter (this follows profits declines for the prior five quarters). The headwinds from a strong US dollar and dropping commodity prices have mostly receded and Wall Street analysts are expecting +3% earnings growth for the third quarter of 2017 for the S&P 500, led by a recovery in Energy profits and continued strength from the Technology sector. However, if the trend holds, earnings growth could jump to over +6% as earnings have surprised on the upside by +3% on average over the past five years. The fourth quarter is expected to see a return to double-digit growth, with analysts forecasting a +11% increase in earnings6.
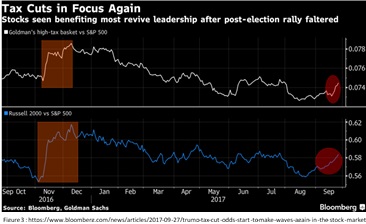
There are also some big picture developments on the horizon for financials markets. After earnings data is digested, the market will keep an eye on some fiscal and monetary policy actions in the US. Tax reform has the attention of US markets as small company stocks (these tend to experience more sensitivity to lower taxes than their larger-company counterparts) and other tax-sensitive sectors have moved peremptorily positive. Both a cut to the corporate rate and a break on repatriation of profits held abroad are estimated to bring an additional $6 to $8 of earnings per share to the S&P 500 – which would represent a roughly 5% boost to growth7. Political effects are often overrated in their impacts on returns but tax cuts are one thing that have an immediate, calculated impact on earnings for some companies. The legislative process will surely move along with fits and starts but the market seems to be regaining optimism that something can be done.
The Fed is expected to hike rates again in December – the futures market is pricing in a 77% probability (according to Bloomberg8) that the target Fed Funds rate will increase to a range of 1.25%-1.50%. This move has been well telegraphed and anticipated by the market. More importantly than setting the rate will be the 2018 policy outlook and how the market reacts to the balance sheet normalization program which is now underway.
Economy:
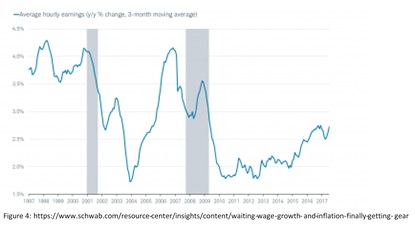
The economy has grinded along in 2017 producing +2.2% growth in the second quarter and an estimated +2.5% for the third according to the Federal Reserve Bank of Atlanta’s GDPNow Forecast9. This growth has bounced off the lows of +1.2% for the second quarter of 2016 and the trend appears favorable. Independent research firm Hedgeye forecasts 3% growth beginning in 201810. The labor market is still strengthening and the unemployment rate fell to 4.2% in September, the lowest since February 2001. The rising wages of workers though is more significant as the 2.8% year-over-year growth in Average Hourly Earnings was the highest growth of the current recovery11. Inflation has remained stubbornly low for some time now, and although this can be positive for some aspects of the economy, an increase towards the Fed’s 2% target would be ideal. There are a lot of factors contributing to low inflation, including low commodity prices, the massive drop in telecommunications subscriber costs and the “Amazon” effect on retail shopping to name a few. The Fed’s policy path may well be dependent on whether or not inflation manifests in 2018.
Adding to economic optimism were multi-year highs for the ISM Manufacturing Index (highest since 2004) and the ISM Non-manufacturing Index (highest since 2005) signaling high activity in the economy across multiple industries. The US is not alone in growing Manufacturing activity as each and every country in the Global Purchasing Managers’ Index for manufacturing is in expansion territory for the August and September 2017 readings. This synchronized expansion has resulted in the highest reading for the Global Manufacturing PMI since May of 2011.12,13
Footnotes:
1. Morningstar Direct data
2. Bloomberg: https://www.bloomberg.com/view/articles/2017-10-09/a-remarkable-run-for-stocks-gets-more-extraordinary?
3. Morningstar Direct data
4. Morningstar Direct data
5. Morningstar Direct data
6. FactSet Earnings Insight: https://insight.factset.com/hubfs/Resources%20Section/Research%20Desk/Earnings%20Insight/EarningsInsight_100617.pdf
7. Bloomberg: https://www.bloomberg.com/news/articles/2017-09-27/trump-tax-cut-odds-start-to-make-waves-again-in-the-stock-market
8. Bloomberg data
9. https://www.frbatlanta.org/cqer/research/gdpnow.aspx
10. Hedgeye: https://app.hedgeye.com/insights/62303-predicting-us-gdp?type=macro
11. Charles Schwab Research: https://www.schwab.com/resource-center/insights/content/waiting-wage-growth-and-inflation-finally-getting-gear
12. JPMorgan Guide to the Markets: https://am.jpmorgan.com/us/en/asset-management/gim/adv/insights/guide-to-the-markets/viewer
13. Yardeni Research: http://blog.yardeni.com/2017/09/global-synchronized-growth-why-now.html
The views expressed herein are those of John Nagle on October 10, 2017 and are subject to change at any time based on market or other conditions, as are statements of financial market trends, which are based on current market conditions. This information is provided as a service to clients and friends of Kavar Capital Partners, LLC solely for their own use and information. The information provided is for general informational purposes only and should not be considered an individualized recommendation of any particular security, strategy or investment product, and should not be construed as, investment, legal or tax advice. Past performance does not ensure future results. Kavar Capital Partners, LLC makes no warranties with regard to the information or results obtained by its use and disclaims any liability arising out of your use of, or reliance on, the information. The information is subject to change and, although based on information that Kavar Capital Partners, LLC considers reliable, it is not guaranteed as to accuracy or completeness. This information may become outdated and we are not obligated to update any information or opinions contained herein. Articles may not necessarily reflect the investment position or the strategies of our firm.