
Quarterly Investment Research Note – July 11th, 2024
2nd Quarter 2024 Summary
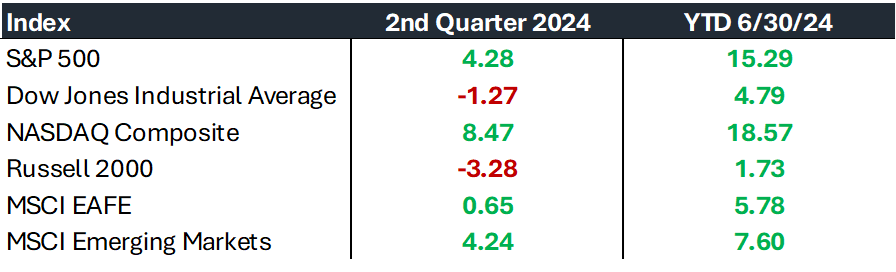
- Narrow leadership continued to carry US large-cap stocks to new all-time highs throughout the 2nd quarter with the S&P 500 finishing up +4.28% for the quarter and up +15.29% for the year through 6/30/24. Mega-cap growth stocks, particularly those in the Technology and Communication Services sectors, continued to lead the market.1
- The headline strength, however, masked negative performance amongst other areas of the market, as the average S&P 500 stock was down -2.03% for the 2nd quarter, with the S&P Small Cap 600 and the S&P Mid Cap 400 down -2.54% and -3.13% respectively.2
- Internationally, Emerging Markets were a bright spot, posting a gain of 4.24% for the quarter and finishing up +7.60% for the first half of the year, as measured by the MSCI EM Index. Developed Markets, as measured by the MSCI EAFE Index, were up +0.65% for the quarter and up +5.78% for the year.3
- A renewed stability in interest rates was a welcome development for investors. The yields on 2-year and 10-year Treasuries only slightly moved during the 2nd quarter with yields essentially unchanged for both key maturities. The Bloomberg US Aggregate Bond Index was effectively unchanged, up 0.07% for the quarter and is down -0.42% for the year.4
- The economy can best be described as: “slowing while still growing”. The labor market showed some signs of softening during the second quarter, with the unemployment rate reaching 4.1%, its highest level since November 2021, alongside some slowdown in consumer spending data.5 Projections indicate ongoing economic growth in the second quarter; however, the deceleration in certain measurements requires vigilance.6
- The Federal Reserve is contemplating potential rate cuts in 2024, with the fixed income markets anticipating reductions in September and December.7 After an unexpected rise in inflation during the first quarter, the second quarter saw progressive disinflation, bolstering confidence in the Fed’s ongoing efforts to achieve its inflation target. Coupling that with the softening labor market, the other side of the Fed’s dual mandate, leads to a more balanced view of risks from the Fed.
2nd Quarter 2024 Market Recap and Outlook
During the 2nd quarter the S&P 500 pushed to multiple new all-time highs, recovering swiftly from a -5.46% pullback in April. The rest of the quarter was a steady march upward. Over the last two months, the S&P 500 had no single days where the market fell even -1% and the max pullback was only -1.61%. The +4.28% return for the quarter, on the heels of the strong 1st quarter, put the S&P 500 at +15.29% for the first half and a torrid +52.15% in less than 2 years off the cyclical lows made in October 2022.8
However, diversified equity investors might not perceive the quarter as strongly, as the market displayed mixed performance globally when excluding the major technology companies driving the Artificial Intelligence (AI) revolution.
While the headline index was up, the average S&P 500 stock fell -2.63% during the quarter and is up only +5.08% through 6/30/24, roughly 1/3rd of the Index return. Small and Mid-caps produced negative results for the 2nd quarter and are only modestly positive for the year. Globally, Developed Markets were basically flat while Emerging Markets were able to keep up with US Large caps, returning +4.24%.9
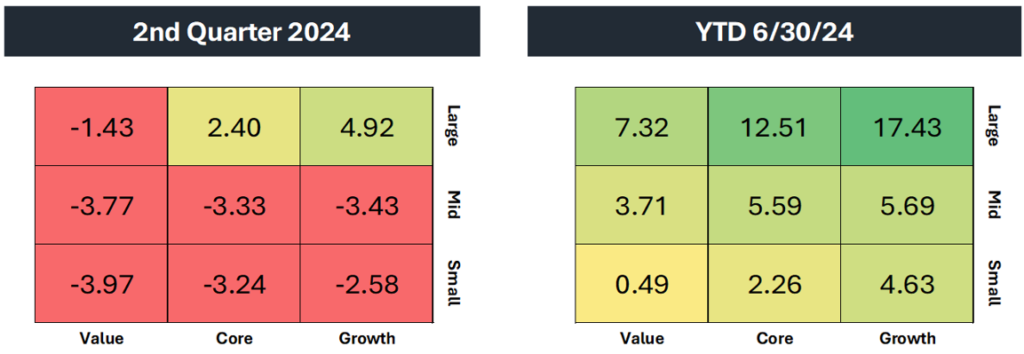
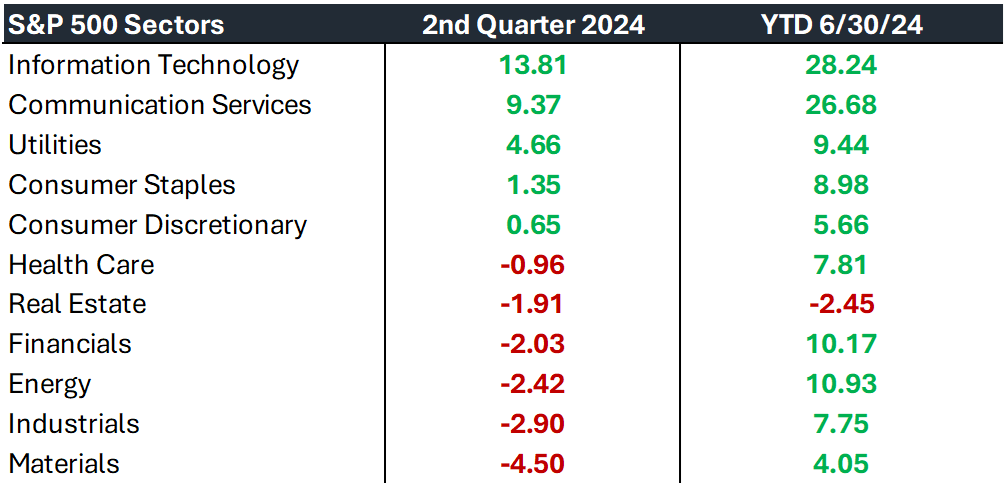
Six out of the eleven industry sectors fell during the quarter; although the strong breadth from the 1st quarter means most sectors remain solidly positive for the year. Growth stocks outpaced Value stocks +9.59% vs. -2.10% during the quarter and are up +23.56% vs. +5.79% for the year, further widening the gap between the two styles that has defined the recent history in equity markets.10
Along with the narrowness in gains, market concentration also reached new modern-day highs. The weight of the Tech-dominant top 10 stocks in the S&P 500 hit 37% at the mid-point of the year, causing the index’s results to largely hinge on the performance of just a few heavily weighted names and creating the challenging environment for active management that proliferates the markets today.11
We again view this concentration as an opportunity for market breadth to catch up in the 2nd half of the year and maintain our focus on rebalancing efforts in portfolio management. This involves capitalizing on strength by selling winners and reallocating proceeds to diversify across sectors, styles, and geographies. As earnings have largely catalyzed the US Large-cap’s surge, and estimates remain elevated there, the expectations for earnings growth strength have shifted in favor of small and mid-cap companies.
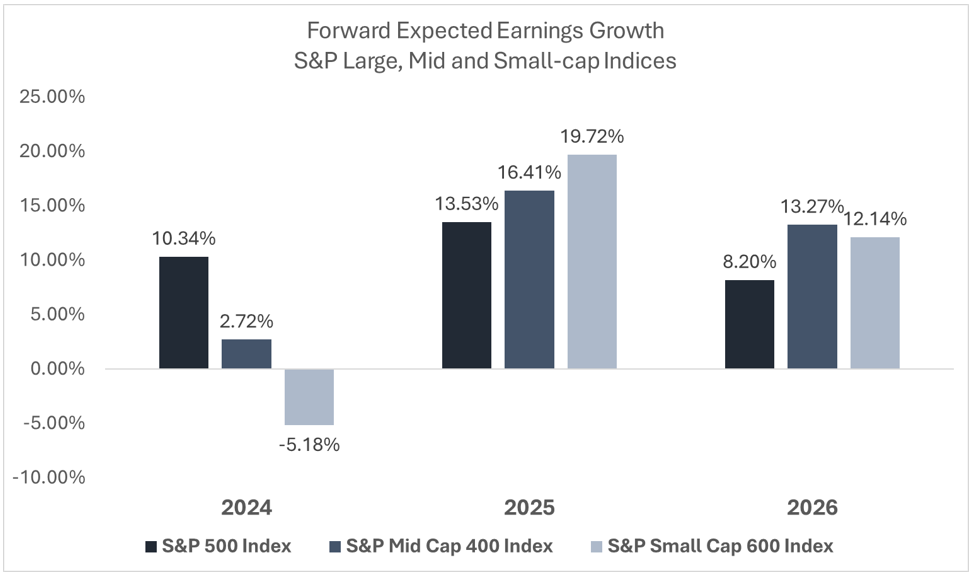
These positive earnings outlooks today serve as both the catalyst for future gains and the biggest risk to the markets. Expectations across the board are for above average earnings growth in 2025 and 2026 and are elevated at the same time there are relatively high valuations for the S&P 500 (largely driven by the aforementioned mega-cap companies). This does not imply that companies cannot meet these expectations, but rather that the combination of an optimistic earnings outlook, high valuations, and dependence on a few companies leaves little margin for error for the index.

The positive news for active managers and allocators is that opportunities exist elsewhere. The S&P 500 is trading at 21.6 times its projected earnings for the next 12 months as of 7/10/24, over 3 turns above its 10-year average of 18 times. Yet, the average S&P 500 stock trades at only 16 times its next 12 months’ earnings, below the 10-year average of 16.6 times. Similarly, the S&P Mid Cap 400 and S&P Small Cap 600 indices are also trading below their historical averages at 15 times and 13.8 times, respectively. Additionally, international equities, both in developed and emerging markets, continue to trade at significant discounts compared to the S&P 500.12
After the strong first half of the year, we want to reiterate the view from our outlook at the start of the year that conditions are conducive to equity market strength, including these:
- Moderate economic growth buoyed by a strong labor market and consumer.
- A shift to accommodative monetary policy
- Stable interest rates
- Low and falling inflation
- Currency tailwinds
- Tight corporate credit spreads
And so far, this year has been characterized by strong returns and calm markets, driven by some of these positive economic developments and further amplified by a fundamental follow-through of strong corporate earnings.
However, given the strength and calmness of markets, it is logical to expect and prepare for some equity market volatility in the second half of the year. Historically, the average intra-year decline for the S&P 500 has been -14.2% for any calendar year since 1980, which the market is well short of so far in 2024.13 While a decline in the second half is not guaranteed, it would be well within the realm of expectations and should be considered a normal and healthy part of the market cycle if not part of accompanied by game-changing circumstances.
In fixed income, stable interest rates and credit spreads dampened volatility for bond prices as well. This stability and certainty of rates has supported equity prices as well as allowed bond investors to clip coupons at the higher rates available in today’s regime. The Bloomberg US Aggregate Bond Index was flat for the 2nd quarter, returning +0.07% and is down on the year -0.71% after yields increased during the 1st quarter.14
Credit spreads were steady throughout the quarter as the stronger-than-expected economic environment provided support for corporate cash flows and investor confidence. Below investment-grade areas of the market performed the best with the Bloomberg US High Yield Bond Index and the Morningstar LSTA US Leveraged Loan Index returning +1.09% and +1.90% respectively for the quarter.14
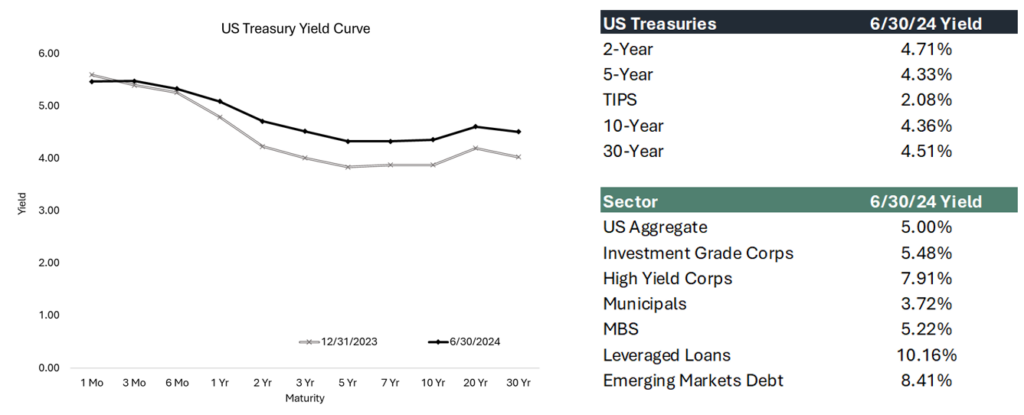
The yield curve remains inverted (long-term yields lower than short-term yields) with the only change in the first half of the year being the near parallel shift up in yields across maturities that occurred in the 1st quarter as monetary policy and growth expectations recalibrated. Consternation surrounding Treasury supply and auctions has calmed down for the time being as buyers’ demand was strong during the quarter.
The latest inflation readings have come in cooler than expected and sparked renewed confidence in the continuation of the disinflationary trend. The latest Consumer Price Index (CPI) data showed this measure of inflation running below 3% year-over-year as of June 2024 for the first time since March 2021.15 This trend coupled with the subtle softening in the labor marker further reinforces the argument that the Fed will begin easing during 2024. Current market expectations after the recent inflation print have centered on rates cuts coming in September and December of this year.
We will continue to stay in close contact with clients throughout the 2nd half as we expect eventful developments in the markets. We appreciate the opportunity to provide these market updates on a quarterly basis and please reach out with any questions regarding the content or as it specifically pertains to your personal investments with Kavar Capital Partners.
John Nagle, CFA
Chief Investment Officer
Footnotes:
- Morningstar Direct Data
- Morningstar Direct Data
- Morningstar Direct Data
- Morningstar Direct Data
- St. Louis Fed FRED Database https://fred.stlouisfed.org/
- Atlanta Fed GDP Now as of 7/10/24 https://www.atlantafed.org/cqer/research/gdpnow
- CME Group FedWatch https://www.cmegroup.com/markets/interest-rates/cme-fedwatch-tool.html
- Morningstar Direct Data
- Morningstar Direct Data
- Morningstar Direct Data
- JPMorgan Guide to the Markets as of 6/30/24 https://am.jpmorgan.com/us/en/asset-management/protected/adv/insights/market-insights/guide-to-the-markets/
- Bloomberg Market Data
- JPMorgan Guide to the Markets as of 6/30/24 https://am.jpmorgan.com/us/en/asset-management/protected/adv/insights/market-insights/guide-to-the-markets/
- Morningstar Direct Data
- Morningstar Direct Data
- St. Louis Fed FRED Database https://fred.stlouisfed.org/
The views expressed herein are those of John Nagle on July 11th, 2024 and are subject to change at any time based on market or other conditions, as are statements of financial market trends, which are based on current market conditions. This market commentary is a publication of Kavar Capital Partners (KCP) and is provided as a service to clients and friends of KCP solely for their own use and information. The information provided is for general informational purposes only and should not be considered an individualized recommendation of any particular security, strategy or investment product, and should not be construed as investment, legal or tax advice. Different types of investments involve varying degrees of risk, and there can be no assurance that any specific investment or strategy will be suitable or profitable for a client’s investment portfolio. All investment strategies have the potential for profit or loss and past performance does not ensure future results. Asset allocation and diversification do not ensure or guarantee better performance and cannot eliminate the risk of investment losses. The charts and graphs presented do not represent the performance of KCP or any of its advisory clients. Historical performance results for investment indexes and/or categories, generally do not reflect the deduction of transaction and/or custodial charges or the deduction of an investment management fee, the incurrence of which would have the effect of decreasing historical performance results. There can be no assurances that a client’s portfolio will match or outperform any particular benchmark. KCP makes no warranties with regard to the information or results obtained by its use and disclaims any liability arising out of your use of, or reliance on, the information. The information is subject to change and, although based on information that KCP considers reliable, it is not guaranteed as to accuracy or completeness. This information may become outdated and KCP is not obligated to update any information or opinions contained herein. Articles herein may not necessarily reflect the investment position or the strategies of KCP. KCP is registered as an investment adviser and only transacts business in states where it is properly registered or is excluded or exempted from registration requirements. Registration as an investment adviser does not constitute an endorsement of the firm by securities regulators nor does it indicate that the adviser has attained a particular level of skill or ability.