
The Tightrope Between Washington and Wall Street
Since it has received such little media attention of late, it has been easy to forget that the presidential election is just over 2 months away…….Ha! OK, bad joke…..I just wish it was a bad dream!
Despite the historically low favorability ratings1 of the major party candidates, absent a meteoric and unlikely ascension from the Libertarians, either Hilary Clinton or Donald Trump will be the next President of the United States.
The campaign trails of both Clinton and Trump have been blazing with vitriol and recrimination. Political disharmony is high. Voter frustration is arguably higher.
While nary a nanosecond passes on business TV without comments on the prospective market implications of the competing party platforms, the S&P 500 has been awfully quiet of late…..and with a positive bias.
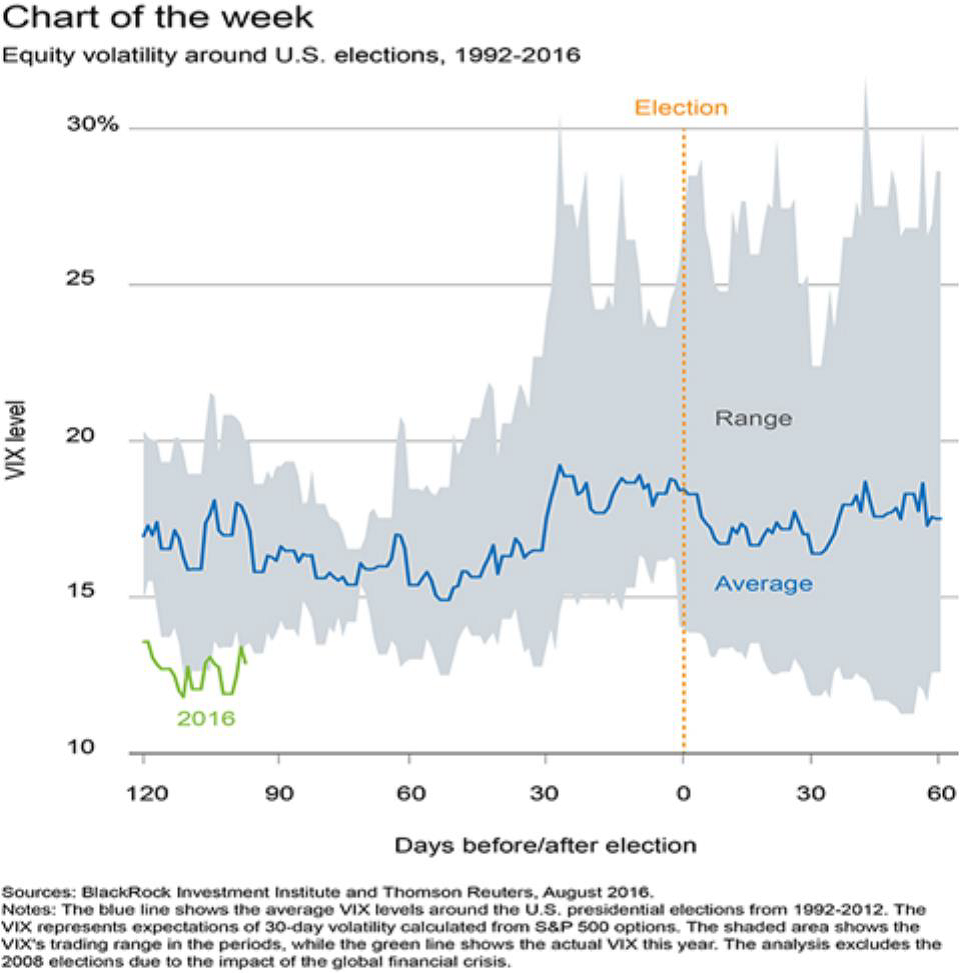
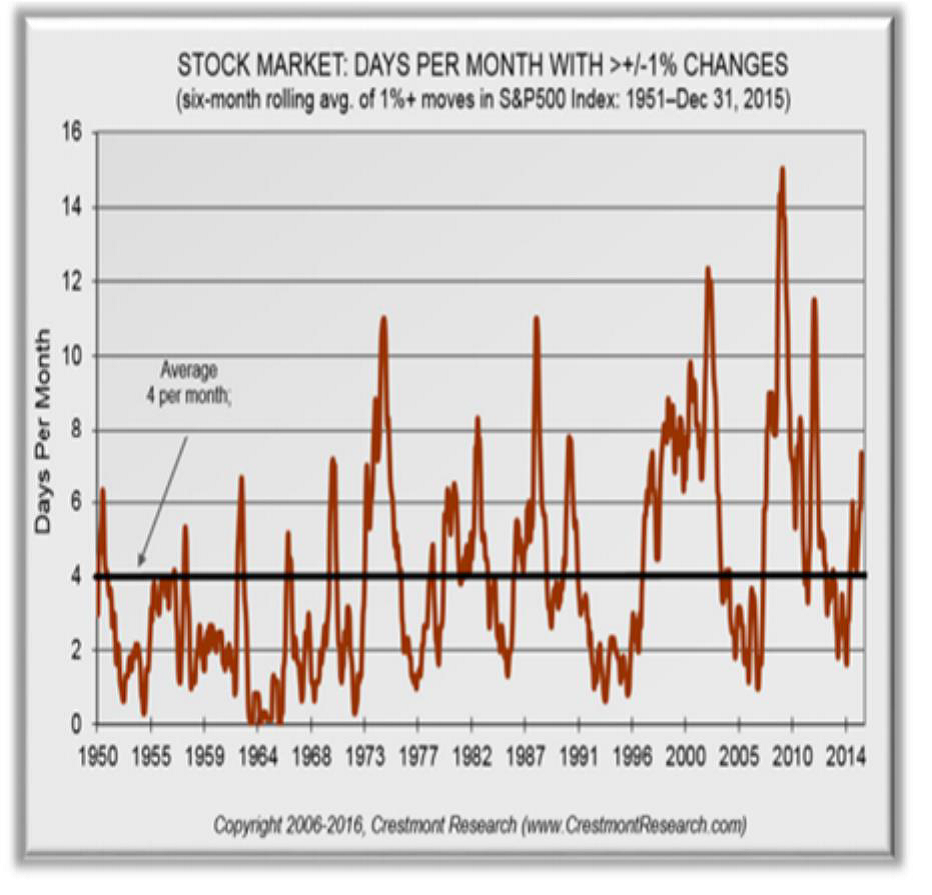
These 2 conditions – quiet and positive – buck precedent for election year market meanderings as demonstrated in the graphics below.
These 2 charts indicate just how relatively muted trading has been – with volatility barely budging as tracked by the VIX. Embedded in this sleepy reading is the fact that it has been 40 trading days since the last move (up or down) of 1% or more in the S&P 500. This compares to a long run average of 4 such moves per month!
This lethargy has surprisingly not impeded stock price advancement as the S&P 500 hit an all-time high on 8/15/16.2
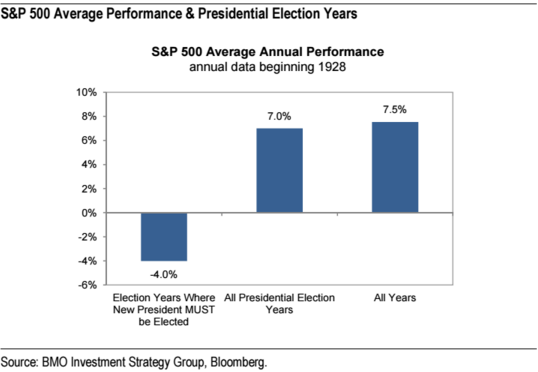
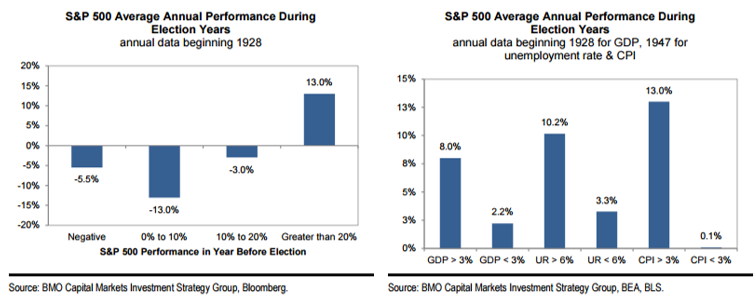
And it has done so while dodging headwinds attendant to election years that: 1. Necessitate a new occupant of the Oval Office; 2. Follow a weak prior year of performance for the index and; 3. Exist amidst ho-hum economic conditions. See below for the graphical support of these preconditions.
Were this market strength to endure, the prospects of a successful Clinton campaign are heightened. As the excerpt from Kiplinger’s attests and the Bloomberg table reinforces, any momentum in markets going into an election strongly favors the party in power:
“Election results may not be so great at predicting stock market returns, but the converse is not the case. It turns out that the stock market has an uncanny ability to predict who will call the White House home for the next four years. If the stock market is up in the three months leading up to the election, put your money on the incumbent party. Losses over those three months tend to usher in a new party.
The statistics are compelling. In the 22 president elections since 1928, 14 were preceded by gains in the three months prior. In 12 of those 14 instances, the incumbent (or the incumbent party) won the White House. In seven of eight elections preceded by three months of stock market losses, incumbents were sent packing. Exceptions to this correlation occurred in 1956, 1968 and 1980. According to Stack, the S&P 500 has an 86.4% success rate in forecasting the election.”4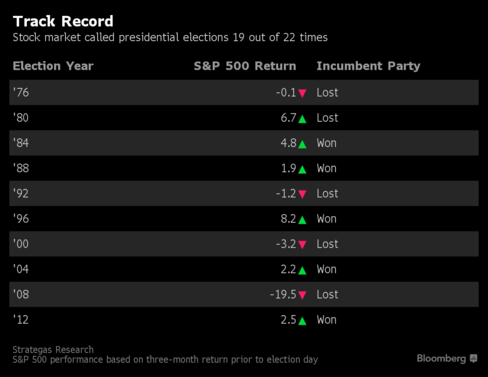
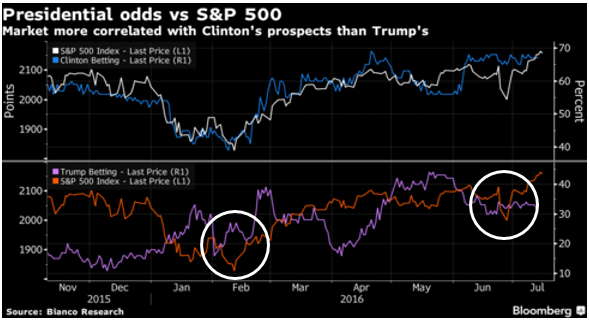
Such momentum is playing out in the betting parlors as well (yes, you can literally purchase options on Presidential candidates’ prospects) as Trump’s implied likelihood of success in November correlates strongest with a drop in stocks – I circled February (low point of the S&P 500 this year) and June (post-Brexit swoon) to highlight this point.
Trump’s victory hopes may hinge on the perpetuation of the following trends, as reported from Nationwide this spring4:
- Returns for the S&P 500 in the three months before past presidential elections have been almost 1% lower than all other months (source: Strategas, as of 4/4/16)
- Stock market volatility in the three months leading up to past presidential elections has been about 45% higher than all other months (source: Factset, as of 1/31/16)
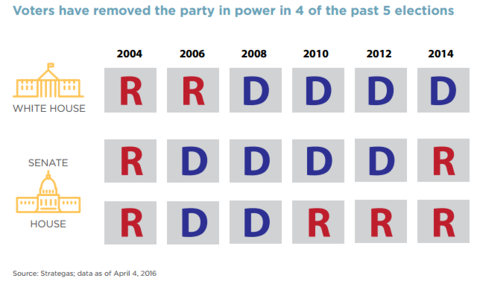
- The potential for the market to surprise as the upcoming election nears, given the recent trend of continuous turnover in party control over different branches of government (see chart below) and the prevalent anti-establishment sentiment among investors [worldwide], evident in the rise of candidates like Donald Trump [and certainly the success of the Brexit vote in the UK.]
Essentially, economic and market tranquility are the ally of the incumbent. Status quo anchors sentiment quite deeply. The initiation of change is attractive only insomuch as its anticipated impact is equally as unpredictable as the current course.
Speaking of that current course and the aforementioned record high hit by the S&P 500, there is growing concern about the market’s valuation. That concern is shared by investors as well as political aspirants.
When stock jockeys sling the term “valuation” around, it is in reference to the number of dollars of price (P) that must be paid for every dollar of earnings (E) for a publicly-traded company, aggregately referred to as the market’s P/E ratio. (For the purpose of this analysis, we’ll consider a metric known as the Cyclically Adjusted P/E, or CAPE).
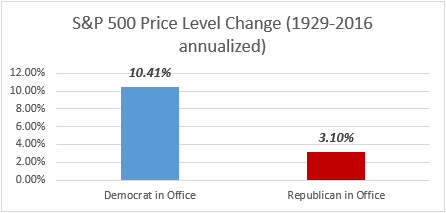
While the chart below shows that the S&P 500 has performed significantly better under Democratic administrations, the primary attribution of that outperformance is the prevailing valuation at each Commander in Chief’s inauguration.
Source: Morningstar
According to some great research by Charlie Bilello of Pension Partners, LLC:
“On average, Democrats have inherited an average CAPE ratio (or Shiller PE) of 14.9 versus 16.6 for Republicans. While not a huge differential, even this small edge was helpful as lower valuation tends to lead to higher future returns on average.
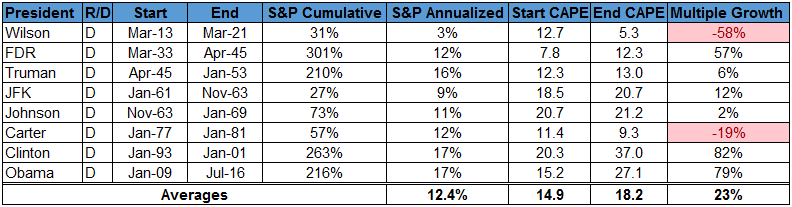
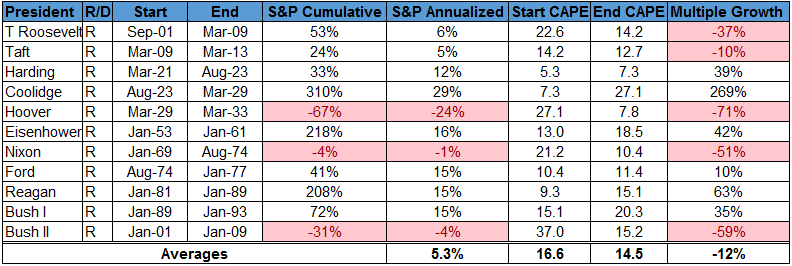
Equally important, though, is the fact that multiples have expanded under Democratic presidencies by 23% (from 14.9 to 18.2) while multiples have contracted under Republicans by 12% (from 16.6 to 14.5).
Also, if we look at the table below, sorted by beginning valuation, you’ll notice that the four highest starting valuations all occurred during Republicans administrations.
The highest in history was under George W. Bush who started with a CAPE ratio of 37.0 (shortly after the Tech Bubble peak) only to see that fall to 15.2 when he left office after the Great Recession. Next was Herbert Hoover, who took office with a CAPE ratio of 27.1 and saw that fall to 7.8 after the Great Depression. Richard Nixon also inherited a relatively high CAPE Ratio of 21.2 and saw that fall to 10.4 after the 1973-74 Bear Market and Recession.
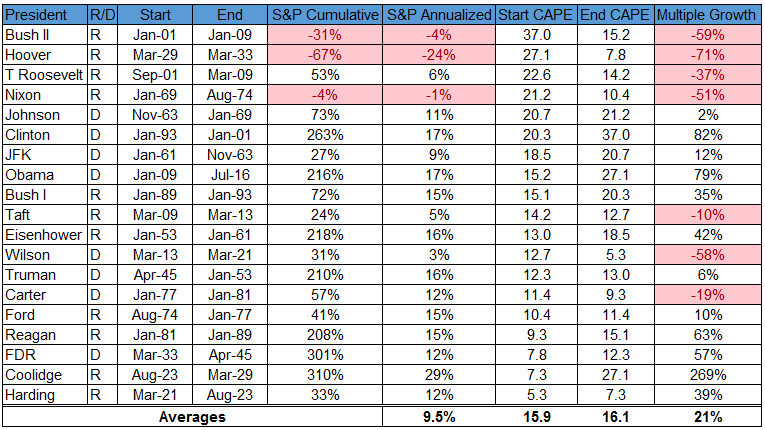
So you have the four worst Bear Markets in history (1929-32, 1973-74, 2000-02, and 2007-09) all occurring mostly under Republican administrations (Hoover, Nixon, and Bush II) that came to power with a high starting valuation. That almost entirely explains the performance differential.”
Bear in mind, that the mean valuation (CAPE) for the market is 16.69 and it stands currently around 27.
That presents a challenge to the incoming president, regardless of their party.
While it is hard to find any common ground between Trump and Clinton, both are outspoken in their support of large fiscal stimulus for the purposes of infrastructure improvements6.
If done effectively, such spending could spawn a virtuous circle of job creationàeconomic improvement àlabor demand and à profit growth…..ultimately raising the “E” and axiomatically lowering the CAPE back into a more historically defendable range.
Of course, any fiscal policy will need support from the Congressional chambers, the aisle sides of which could also be overhauled in November.
Most, if not all, client conversations these days involve certain aspects of the upcoming elections. The intensity of opinions on the outcomes and their impacts are unprecedented.
One client recently referred to the campaign insanity as….”democracy in purgatory!”
That prompted recollection of one my favorite of all Winston Churchill lines, particularly as it relates to the financial markets: “When you are going through hell, keep going.”
Certain sectors of the markets – stocks, bonds, alternatives – will do well regardless of November’s election results and the biasing our balance in the direction of the highest expected returns is a fluid process.
As the results unfold, we’ll be in touch regarding specific opportunities and their implementation into our allocations. So until then, have a wonderful Labor Day holiday weekend and God Bless America! (Oh, and Go Irish!)
1http://www.gallup.com/poll/193376/trump-leads-clinton-historically-bad-image-ratings.aspx
2 Source: Bloomberg Market Data
4https://nationwidefinancial.com/media/pdf/MFM-2306AO.pdf
5https://pensionpartners.com/presidents-cape-ratios-and-stock-market-returns/
Important Disclosures:
The views expressed herein are those of Douglas Ciocca on September 2, 2016 and are subject to change at any time based on market or other conditions, as are statements of financial market trends, which are based on current market conditions. This information is provided as a service to clients and friends of Kavar Capital Partners, LLC solely for their own use and information. The information provided is for general informational purposes only and should not be considered an individualized recommendation of any particular security, strategy or investment product, and should not be construed as, investment, legal or tax advice. Past performance does not ensure future results. Kavar Capital Partners, LLC makes no warranties with regard to the information or results obtained by its use and disclaims any liability arising out of your use of, or reliance on, the information. The information is subject to change and, although based on information that Kavar Capital Partners, LLC considers reliable, it is not guaranteed as to accuracy or completeness. This information may become outdated and we are not obligated to update any information or opinions contained herein. Articles may not necessarily reflect the investment position or the strategies of our firm.