
Investment Research Note – April 12th, 2023
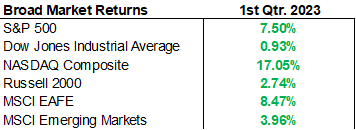
The first quarter of 2023 produced the 2nd consecutive quarter of market gains as broad markets reacted favorably to better-than-expected economic data and falling bond yields, led higher by 2022’s most out of favor sectors. The S&P 500 returned +7.50% for the quarter with the Dow Jones Industrial Average returning a modest +0.93% in comparison. The NASDAQ Composite, heavily weighted toward growth stocks, finished up +17.05%; the best return for the NASDAQ since the 2nd quarter of 2020.1
The S&P 500’s return was driven by strength at the top of the index, particularly Technology stocks, a common theme as the market rallied from the pandemic low (March 2020) that abruptly halted during 2022. The average S&P 500 stock was up just +2.7% while the average performance of the largest 4 companies, who make up over 17% of the index weight, was +22.05%.2
In many ways, the first 3 months of 2023 were a mirror image of all of 2022:
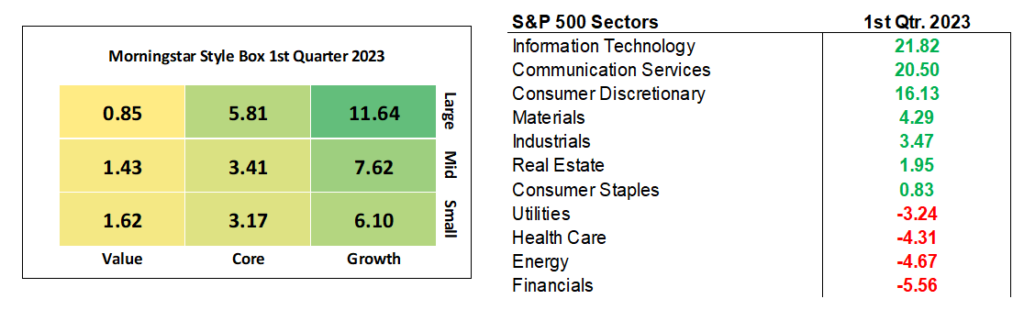
- In 2023, Growth stocks have returned +13.85% vs. +0.91% for Value stocks through 3/31. In 2022, Value stocks outperformed Growth stocks by nearly +20.99%.3
- The Technology sector has led, returning +21.82% in the 1st quarter after losing -28.19% during 2022.
- Energy stocks have lagged, down -4.67% in the 1st quarter, after gaining +65.72% during 2022.4
- The traditional 60/40 portfolio (60% stocks/40% bonds) has returned to favor after being written off in 2022. So far in 2023, the 60/40 portfolio is up +5.57%. 2022 was the worst year in generations for this portfolio as it lost -16.87%.5
- The 10-year US Treasury yield has dropped 40 basis points from 3.88% to 3.48% during the 1st quarter of 2023 after it rose an astounding 236 basis points from 1.52% to 3.88% during 2022.6
- And volatility has dropped. The CBOE Volatility Index (VIX) has averaged 20.55 during 2023 vs. 25.64 during 2022.7
Breaking out the style boxes, Large-Cap Growth stocks performed the best during the quarter posting a +11.64% gain. Value stocks were the laggards with Large-Cap Value, Mid-Cap Value, and Small-Cap Value all returning modestly positive quarters, +0.85%, +1.43% and +1.62%, respectively. Regional banks weighed heavily on the Small and Mid-Cap Value styles.8
Globally, the MSCI EAFE Index (developed countries) returned +8.47% during the quarter, besting US stocks for the 2nd consecutive quarter. Europe continues to be a significant area of strength for global markets. The FTSE Europe 100 Index was up +15.27% for the 1st quarter, in spite of ongoing growth fears and geopolitical risks. The MSCI Emerging Markets Index finished the quarter up +3.96%.9
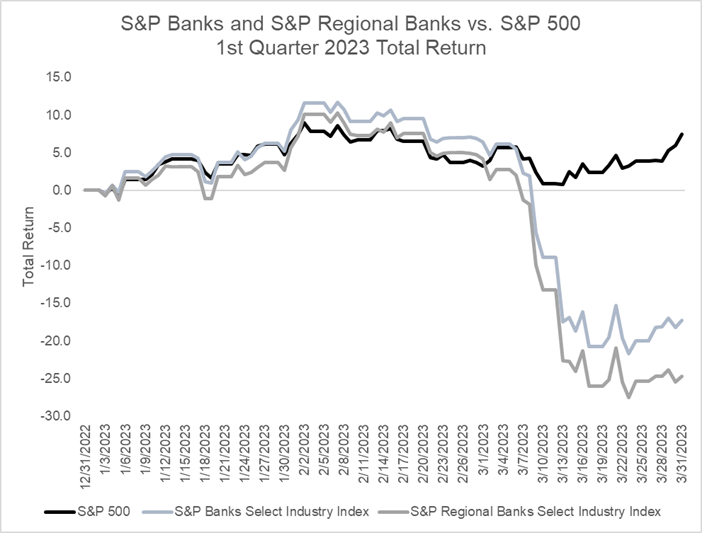
In March, a banking crisis seized the market discourse, as Silicon Valley Bank and Signature Bank became the 2nd and 3rd largest bank failures in US history10. The banks collapsed under the pressure put on their balance sheets by raising rates amidst a rapidly shrinking deposit base. Although the government stepped in to ultimately protect uninsured deposits amidst the failures, the collateral damage created contagion fears concentrated in the banking sector. The S&P Regional Bank Index lost -24.73% during the 1st Quarter. Larger banks also felt the pain, as the S&P Bank Index lost -17.26%.11
In reaction to the upheaval in banking, the market flipped expectations for the Fed’s hiking cycle. Going into March, the Fed Funds futures market had priced in an even tighter Fed than what was expected at the end of 2022, after digesting stubborn inflation and better-than-expected jobs market data in January and February.12 The Fed had seemingly finally coerced the market to join them in the “higher for longer” camp that they had been constantly reinforcing on the Fed Governor speaking circuit.
However, as the banking crisis unfolded it provided direct evidence of the lagged and variable impacts of Fed tightening and gave new credibility to calls for the Fed to slow-down or halt the hiking cycle for the sake of financial stability. The line of thinking went that banks will be forced to pull back on lending and increase borrowing standards, thereby tightening financial conditions. In a way, banks would be forced to do some of the Fed’s intended tightening work for them, increasing the risks of a hard landing for the economy. The Fed must now balance their ongoing inflation fight with preserving stability of the banking system – the importance of which can’t be understated.
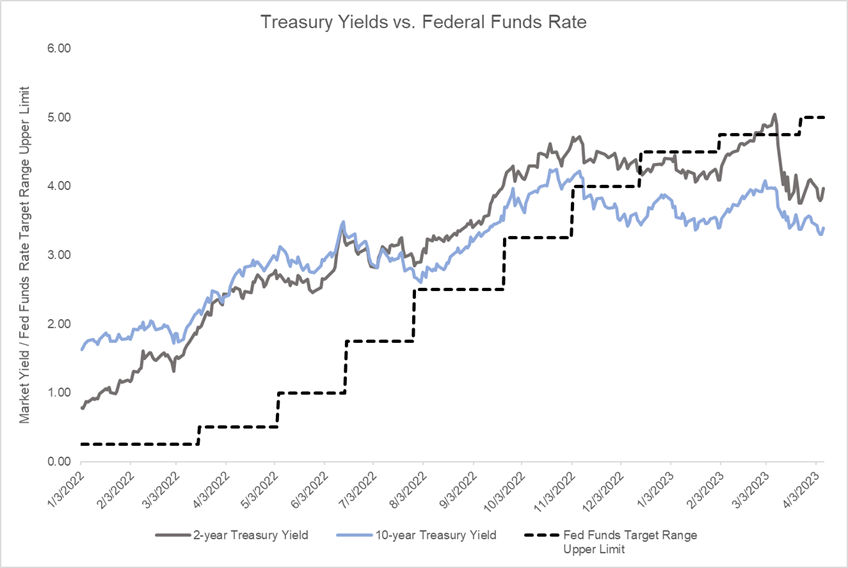
The market is currently pricing in a terminal rate (where the Fed will stop hiking) of just above 5%, with the last 25 basis points (0.25%) hike coming at the May FOMC meeting. The market is then anticipating rate cuts to begin later this year with a year-end Fed Funds Target range at 4.25-4.50%, a departure from what the FOMC forecasted at the March FOMC meeting (5.00-5.25%). This would be a deviation from what current Fed speakers have continued to emphasize – “higher for longer”.13
Additionally, The 2-year Treasury yield, which has reliably forecasted the Fed’s rate hiking path has fallen significantly below the current Fed Funds rate for the first time in this tightening cycle, another sign that the Fed’s hiking initiative is nearing its end.14,15 It’s difficult to foresee a scenario where the Fed Funds rate stays significantly above the 2-year Treasury yield for a sustained period of time.
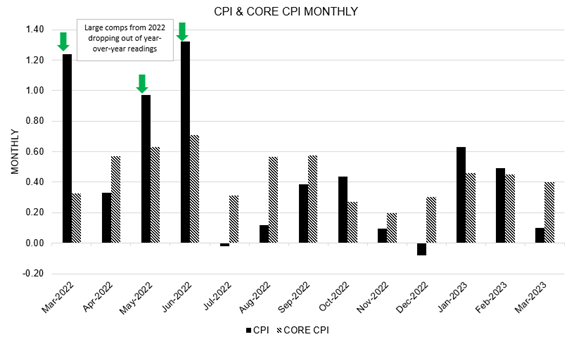
The inflation picture has continued to improve, including the latest March CPI reading, the year-over-year growth rate of CPI has fallen for 9 consecutive months. As of March, CPI is running at 5% compared to last year, still too high but progressing in the right direction. And with the March reading, the massive comparisons from 2022 will begin to fall off the year-over-year reading meaning that we expect the inflation narrative to change during this summer as year-over-year prints fall below 4%.16 It’s safe to say inflation has peaked for this cycle and the downwards trend is undeniable even while admitting the path is unlikely to be straight down in a linear fashion. The larger question for the Fed is how they will deal with flare-ups in monthly inflation readings and how patient they can be getting to the 2% target as inflation has gone from a boil to a simmer.
Along with the fall in bond yields, Fixed Income markets produced positive returns across the board in Q1. The Bloomberg US Aggregate Bond Index finished the quarter up 2.96%. Likewise, corporate credit issues saw strength, with the iBoxx Liquid Investment Grade Bond Index up +4.46% and the Bloomberg US High Yield Index up 3.57%. Credit held in despite tremors from the banking crisis as spreads on High Yield bonds only moved from 3.98% to 5.22% from March 7th through March 24th at the height of the uncertainty and have since come in slightly.17
Looking ahead, the next few weeks’ action will largely hinge on earnings as companies report updated financials and speak to investors and the analyst community. The earnings picture is certainly dim but not dire; according to estimates, S&P 500 earnings are expected to be down -7.7% this quarter vs the prior year’s 1st quarter and down -6.6% next quarter vs. the prior year’s 2nd quarter which would make 3 consecutive quarters of declining earnings growth. This decline is mainly due to margin compression as companies deal with higher costs. We’ll be keeping a close eye on company earnings and guidance as the length and depth of this earnings recession (whether it is better or worse than expected) is a critical fundamental input for stocks for the rest of the year.18
As we look out past this period of weak earnings growth, estimates are optimistic for a return to earnings growth in the back half of 2023 and in 2024. As the market is a forward-looking mechanism, it to will look through the current weakness to future strength and begin to price these figures into valuations.19
Please reach out to any member of the Kavar team with questions or concerns, we look forward to connecting with you directly in regard to your personal portfolios and circumstances.
Footnotes:
- Morningstar Direct Data
- Morningstar Direct Data
- Morningstar Direct Data
- Morningstar Direct Data
- Morningstar Direct Data
- US Treasury https://home.treasury.gov/resource-center/data-chart-center/interest-rates/TextView?type=daily_treasury_yield_curve&field_tdr_date_value=2023
- St. Louis Federal Reserve https://fred.stlouisfed.org/series/VIXCLS
- Morningstar Direct Data
- Morningstar Direct Data
- CNBC https://www.cnbc.com/2023/03/13/signature-bank-third-biggest-bank-failure-in-us-history.html
- Morningstar Direct Data
- CME Group FedWatch Tool https://www.cmegroup.com/markets/interest-rates/cme-fedwatch-tool.html
- CME Group FedWatch Tool https://www.cmegroup.com/markets/interest-rates/cme-fedwatch-tool.html
- St. Louis Federal Reserve https://fred.stlouisfed.org/series/DGS2
- St. Louis Federal Reserve https://fred.stlouisfed.org/series/EFFR
- St. Louis Federal Reserve https://fred.stlouisfed.org/series/CPIAUCSL
- Morningstar Direct Data
- Yardeni Research https://www.yardeni.com/pub/yriearningsforecast.pdf
- Yardeni Research https://www.yardeni.com/pub/yriearningsforecast.pdf
The views expressed herein are those of John Nagle on April 12th,,2023 and are subject to change at any time based on market or other conditions, as are statements of financial market trends, which are based on current market conditions. This market commentary is a publication of Kavar Capital Partners (KCP) and is provided as a service to clients and friends of KCP solely for their own use and information. The information provided is for general informational purposes only and should not be considered an individualized recommendation of any particular security, strategy or investment product, and should not be construed as investment, legal or tax advice. Different types of investments involve varying degrees of risk, and there can be no assurance that any specific investment or strategy will be suitable or profitable for a client’s investment portfolio. All investment strategies have the potential for profit or loss and past performance does not ensure future results. Asset allocation and diversification do not ensure or guarantee better performance and cannot eliminate the risk of investment losses. The charts and graphs presented do not represent the performance of KCP or any of its advisory clients. Historical performance results for investment indexes and/or categories, generally do not reflect the deduction of transaction and/or custodial charges or the deduction of an investment management fee, the incurrence of which would have the effect of decreasing historical performance results. There can be no assurances that a client’s portfolio will match or outperform any particular benchmark. KCP makes no warranties with regard to the information or results obtained by its use and disclaims any liability arising out of your use of, or reliance on, the information. The information is subject to change and, although based on information that KCP considers reliable, it is not guaranteed as to accuracy or completeness. This information may become outdated and KCP is not obligated to update any information or opinions contained herein. Articles herein may not necessarily reflect the investment position or the strategies of KCP. KCP is registered as an investment adviser and only transacts business in states where it is properly registered or is excluded or exempted from registration requirements. Registration as an investment adviser does not constitute an endorsement of the firm by securities regulators nor does it indicate that the adviser has attained a particular level of skill or ability.