
Investment Research Note – April 7th, 2022
Written by: John Nagle, CFA
Volatility dogged investors nearly every day and in nearly every corner of the market in the 1st quarter of 2022. After a stellar year for US stocks in 2021, multiples compressed, mainly in growth stocks, as bond yields rose in conjunction with the Federal Reserve pivoting to a more aggressive tightening posture and as inflation continued to permeate with little signs of slowing. Energy prices were pressured upwards and markets downwards as the Russian invasion of Ukraine escalated.
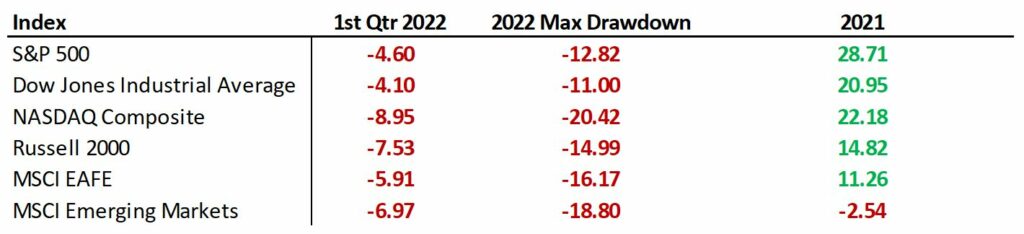
For the quarter, the S&P 500 lost -4.60%, with some relief coming by way of a strong March rally for equities. The volatility especially centered on growth stocks early in the year as the highest valuation stocks experienced significant multiple compression. The NASDAQ Composite lost -8.95% for the quarter, while the Dow Jones Industrial Average lost -4.10%. Down the size scale, small-cap stocks underperformed, as the Russell 2000 lost -7.53% for the three months. At their worst levels, the S&P 500 was down -14.61% from its all-time highs, while the NASDAQ was down -22.51% and the Russell 2000 down -22.94%.1
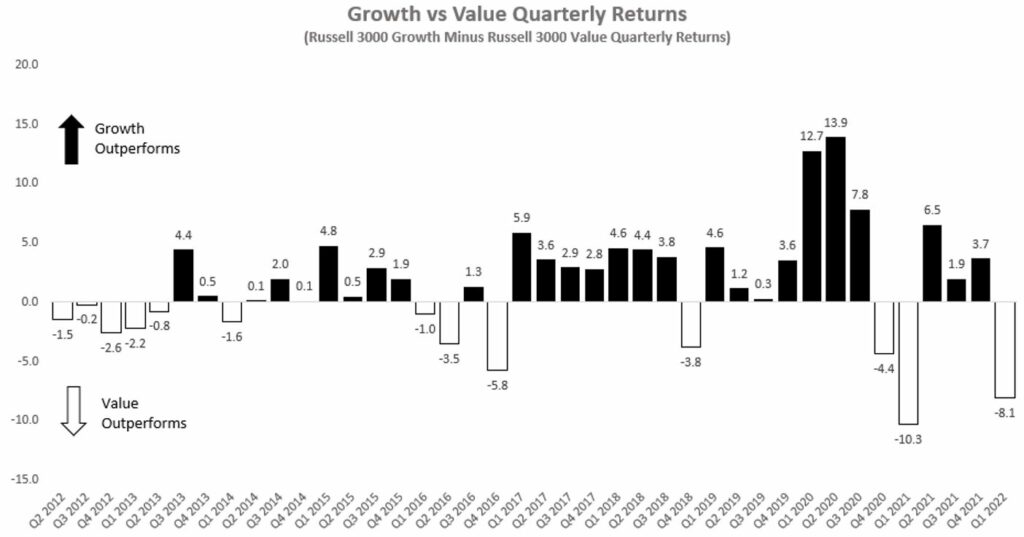
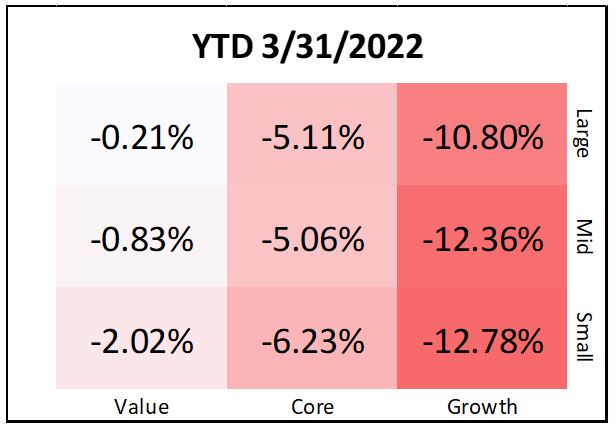
Value stocks outpaced Growth stocks for just the fourth time in a calendar quarter over the past five years as investors rotated out of high-growth, high-multiple, and high-uncertainty Technology and Consumer names. The popular line of thinking that Value stocks would outperform in a rising rate and inflationary environment certainly came to fruition this quarter.
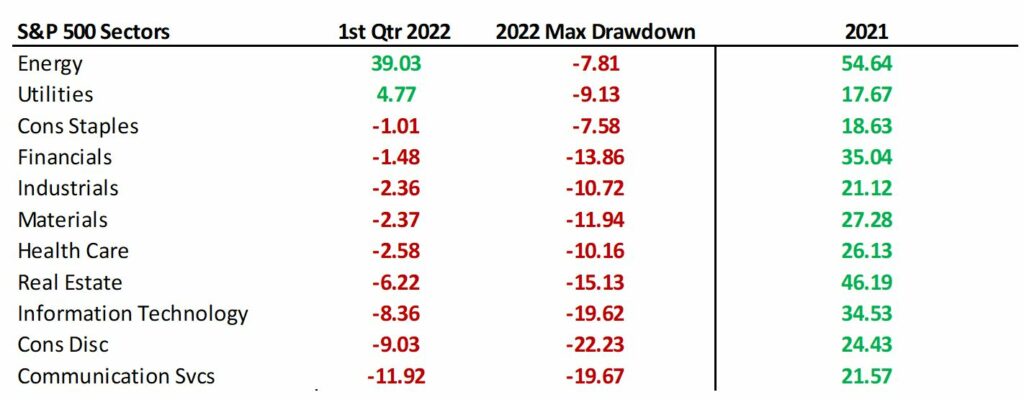
The best performing sector, by far, was Energy as commodity prices soared. Energy stocks finished the quarter up +39.03% and were joined only by the traditionally defensive Utilities sector (+4.77%) in seeing gains. Communication Services, Consumer Discretionary, and Technology stocks saw the largest drops, losing -11.92%, -9.03% and -8.36% respectively. Financials, Healthcare and Consumer Staples stocks fared relatively well, losing -1.48%, -2.58% and -1.01% respectively.2
Outside of the US, International stocks finished at similarly weak levels after starting the year off well. The MSCI EAFE Index lost -5.79% and the MSCI Emerging Markets Index lost -6.97% for the quarter. European markets dropped swiftly as the violence broke out in Eastern Europe. Germany felt the impact especially hard given its reliance on natural resource imports from Russia, with German stocks down -12.54% for the quarter. China was a notable underperformer among Emerging countries, losing -14.27%.3
Commodities were one of the few areas of strength for the quarter. The Bloomberg Commodity index was up +25.55% for the quarter, as large gains were had in energy commodities: WTI Crude Oil (+38.34%), Natural Gas (58.46%), and Unleaded Gasoline (+36.78%) as well as Food and Agricultural commodities: Wheat (+29.56%), Corn (+26.26%), and Soybeans (+20.71%). Precious metals lagged the broad commodity complex, but Gold and Silver still posted gains of +6.59% and +7.50% for the quarter. 4
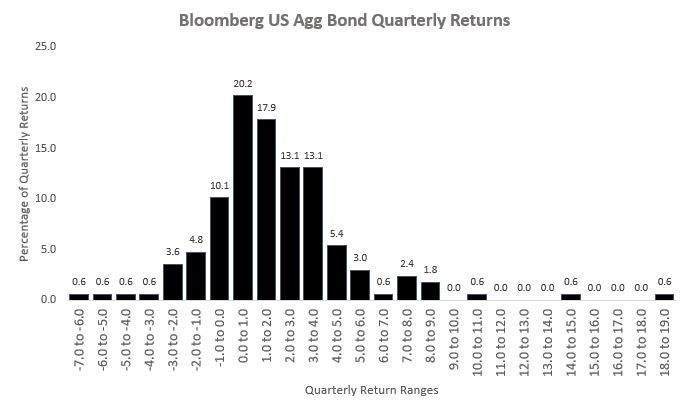
Volatility in the stock market is the standard, but volatility in fixed income markets is uncommon and extremely troubling to investors. When the inverse relationship between stocks and bonds doesn’t work a core principle of portfolio management is challenged. The Bloomberg US Aggregate Bond Index fell -5.93% during the quarter, it’s worst calendar quarter since 1981. To illustrate how large of an outlier this quarter was for bonds, the chart below shows the distribution for all quarterly returns for the Bloomberg US Aggregate Bond Index going back to 1980. Nearly half of all quarters (48.2%) fall with in a range of -1% to +1%. Only two quarters in the history of the index have seen drops of -5% or worse.5
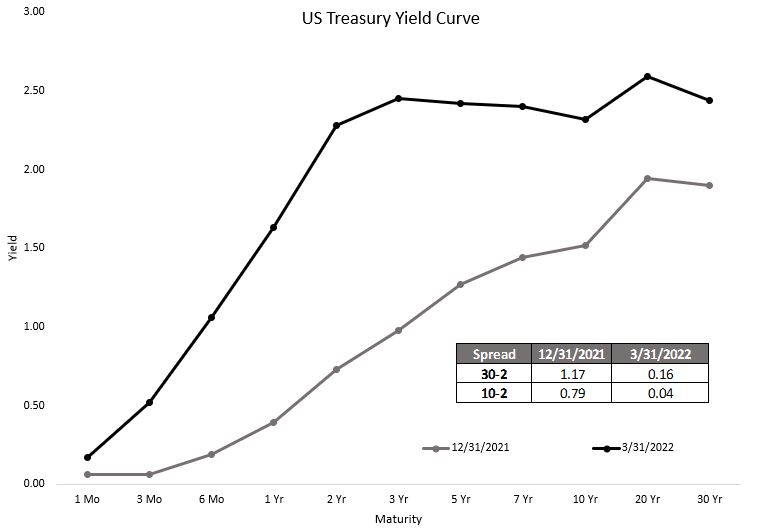
The driving force behind the drop is the rise in interest rates as the market adjusted to a hawkish Fed and inflation stubbornly at 40-year highs.6 The yield on the 10-year Treasury rose by over 1% during the -quarter, moving from 1.52% to 2.61%. On the short-end of the curve, the 2-year Treasury yield moved even more dramatically, up from 0.73% to 2.28% at the end of the quarter.7 The yield curve inverted briefly; an ominous signal closely followed by market participants as a harbinger of future economic weakness.
Moving into credit sectors, US Investment Grade Corporate Fixed Income, impacted again by rising rates, finished down -8.35% while US High-Yield finished down -4.84%. The relative outperformance of lower quality high-yield emphasized the calmness in credit markets as the current economic outlook remained on solid footing. Emerging Market bonds were a major pain point globally for fixed income markets as these credits weakened in sympathy with the extreme deterioration in the Russian and Ukrainian economies, the benchmark for Emerging Market debt was down-11.54% for the quarter.8
As the 2nd quarter begins, the market has returned focus to the Federal Reserve’s path as hawkish rhetoric has intensified this week and the plan for tapering crystalized somewhat. The markets appear fully prepared for a 50 basis points (1/2 of 1%) hike in May and the Fed Funds Futures market has priced an additional 175 basis points worth of hikes after that for a total of 10 rate hikes during 2022.9 These hikes would bring the Fed Funds Target range to 2.50%-2.75%, one notch higher than the range in December 2018 when the Fed ended its last hiking cycle.
The Fed is looking to engineer a “soft landing” – reducing inflation within an overheating economy while avoiding a recession — a massively difficult and historically improbable proposition. While these monetary policy dynamics will continue to steer market sentiment for the rest of the year along with the several externalities lingering in the background, it’s important to recall the strength of the US economy, highlighted by a strong labor market, and the profit outlook for corporations which remains in growth mode. These two broad fundamental tent poles support asset growth and successful long-term portfolio outcomes in the midst of the short-term uncertainty that has characterized markets thus far this year.
We’ll keep in close touch as we sift through the market and economic developments, please reach out to our team with questions/comments on how the information presented in this update is impacting your portfolio specifically.
Footnotes:
- Morningstar Direct Data
- Morningstar Direct Data
- Morningstar Direct Data
- Morningstar Direct Data
- Morningstar Direct Data
- St. Louis Federal Reserve https://fred.stlouisfed.org/series/CPIAUCSL
- US Treasury https://home.treasury.gov/resource-center/data-chart-center/interest-rates/TextView?type=daily_treasury_yield_curve&field_tdr_date_value=2022
- Morningstar Direct Data
- CME Group FedWatch https://www.cmegroup.com/trading/interest-rates/countdown-to-fomc.html
The views expressed herein are those of John Nagle on April 7th, 2022 and are subject to change at any time based on market or other conditions, as are statements of financial market trends, which are based on current market conditions. This market commentary is a publication of Kavar Capital Partners (KCP) and is provided as a service to clients and friends of KCP solely for their own use and information. The information provided is for general informational purposes only and should not be considered an individualized recommendation of any particular security, strategy or investment product, and should not be construed as, investment, legal or tax advice. Different types of investments involve varying degrees of risk, and there can be no assurance that any specific investment or strategy will be suitable or profitable for a client’s investment portfolio. All investment strategies have the potential for profit or loss and past performance does not ensure future results. Asset allocation and diversification do not ensure or guarantee better performance and cannot eliminate the risk of investment losses. Charts and graphs presented do not represent the performance of KCP or any of its advisory clients. Historical performance results for investment indexes and/or categories, generally do not reflect the deduction of transaction and/or custodial charges or the deduction of an investment management fee, the incurrence of which would have the effect of decreasing historical performance results. There can be no assurances that a client’s portfolio will match or outperform any particular benchmark. KCP makes no warranties with regard to the information or results obtained by its use and disclaims any liability arising out of your use of, or reliance on, the information. The information is subject to change and, although based on information that KCP considers reliable, it is not guaranteed as to accuracy or completeness. This information may become outdated and KCP is not obligated to update any information or opinions contained herein. Articles herein may not necessarily reflect the investment position or the strategies of KCP. KCP is registered as an investment adviser and only transacts business in states where it is properly registered or is excluded or exempted from registration requirements. Registration as an investment adviser does not constitute an endorsement of the firm by securities regulators nor does it indicate that the adviser has attained a particular level of skill or ability.