
Market Update – March 29th, 2022
Written by John Nagle, CFA
Good afternoon,
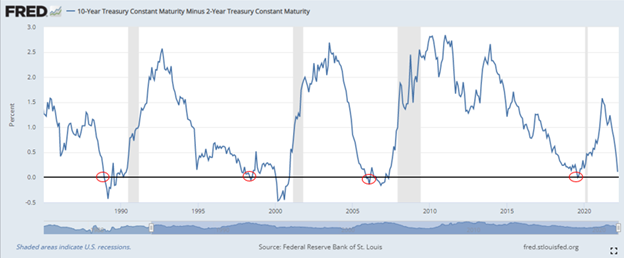
During today’s trading session, the yield on the 2-year Treasury note briefly surpassed the yield on the 10-year Treasury note, creating an inversion of the key yield curve measure for the first time since August 2019.1 The inversion was short-lived as the 10-year yield moved back above the 2-year yield almost immediately after.2
The 10-year minus 2-year spread began the year at 0.79% but this gap has quickly deteriorated as the short-end of the curve priced in the more aggressive tightening path of the Fed and the long-end responded less enthusiastically, this is known as a flattening yield curve. Yesterday’s close showed just a 0.11% spread3 between the maturities which further flattened during the day today, ending at roughly 0.02%4.
A yield curve inversion occurs when a long-term rate falls below a short-term rate and is generally viewed as a signal of economic weakness. There are many ways to measure it using different maturities for the short-term and long-term rates but the 10-year minus the 2-year is a closely followed data point. Yield curves should naturally slope upwards as investors holding longer-term debt have taken on more risk; when they invert, the risk/return imbalances are indicative of shifting investor positioning and outlook. Yield curve inversions have historically been a reliable predictor of recessions as they have preceded every economic contraction since 1955.5
The logical questions to ask after this event are two-fold
- When is the recession starting (or has it already started)?
While yield curve inversions have consistently preceded recessions, the contractions haven’t started before or at the time of the inversion – there is a lag from the point of inversion to the recession. This lag varies widely between occurrences.
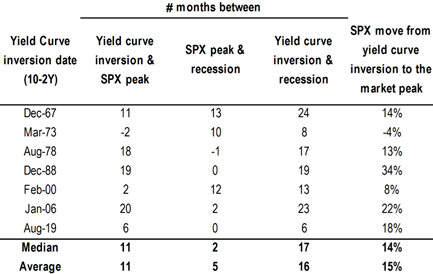
Over the past 7 instances of the yield curve yield inverting going back to 1967, the average lag time has been 16 months with a range between 6 to 24 months.6
Looking at this data, one could be critical of a prediction that sometimes takes two full years to come to fruition – did the yield curve inversion really predict the housing crisis in January 2006 and finally prove correct in 2008? Did the yield curve inversion see COVID coming in August 2019? No, it was likely more consequential in these examples as the yield curve inverting is not in and of itself a death knell for the economy in the short-term.
Now when the US economy inevitably falls into its next recession, pundits will come back to this day and point to the inversion as the proverbial canary in the coal mine when in all likelihood the yield curve inverting is simply one signal among the countless economic signals that determine the condition and direction of the economy and shape investor sentiment. Certainly, a worthwhile observation, and one that points to a rising probability of an economic slowdown, but many other developments will contribute to whether or not the economy sees further expansion.
So, the short answer is No. The yield curve inversion does not mean a recession is imminent and current data points to the economy continuing to expand this year.
2. What does this mean for the stock market?
Partially for the reasons mentioned above, stocks historically have not reacted negatively in the short-term to the yield curve inversion event. Historically, over the same prior 7 inversions, the peak in the S&P 500 has come on average 11 months after the inversion with a range of 2 months before the inversion and as long as 20 months after. The average return for the S&P 500 from the point of inversion to the market peak has averaged 15% during those periods; and again, varied widely but are mainly positive.7
As with the economy, the yield curve inversion is one of many inputs that factor into our expectations for future market performance. We can go ahead and add the inversion to the “wall of worry” that now includes an extremely hawkish Federal Reserve, surging commodity prices and general inflation, the Russia/Ukraine conflict, and COVID that will undoubtedly be heavily discussed in the financial media over the new few days.
Meanwhile, and in spite of these concerns, markets have seen a solid rebound over the past few weeks and a clear dampening of the volatility that has characterized 2022. The S&P 500 has returned +12.56% from the intraday low recorded on the morning of February 24th and the CBOE Volatility Index (VIX) has closed below 20 and at its lowest closing level since January 14th of this year.8
We’ll stay in close touch as we mark the end of the first quarter this week and please do not hesitate to reach out to our team with questions/comments on how the information presented in this update is impacting your portfolio specifically.
Footnotes:
- Federal Reserve Bank of St. Louis, 10-Year Treasury Constant Maturity Minus 2-Year Treasury Constant Maturity [T10Y2Y], retrieved from FRED, Federal Reserve Bank of St. Louis; https://fred.stlouisfed.org/series/T10Y2Y, March 28, 2022.
- Bloomberg Market Data
- US Dept. of the Treasury Daily Treasury Par Yield Curve Rates https://home.treasury.gov/resource-center/data-chart-center/interest-rates/TextView?type=daily_treasury_yield_curve&field_tdr_date_value=2022
- Blomberg Market Data
- Federal Reserve Bank of San Francisco, Michael D. Bauer and Thomas M. Mertens, 3/5/2018 https://www.frbsf.org/economic-research/publications/economic-letter/2018/march/economic-forecasts-with-yield-curve/
- JPMorgan Research
- JPMorgan Research
- Morningstar Market Data
The views expressed herein are those of John Nagle on March 29, 2022 and are subject to change at any time based on market or other conditions, as are statements of financial market trends, which are based on current market conditions. This market commentary is a publication of Kavar Capital Partners (KCP) and is provided as a service to clients and friends of KCP solely for their own use and information. The information provided is for general informational purposes only and should not be considered an individualized recommendation of any particular security, strategy or investment product, and should not be construed as, investment, legal or tax advice. Different types of investments involve varying degrees of risk, and there can be no assurance that any specific investment or strategy will be suitable or profitable for a client’s investment portfolio. All investment strategies have the potential for profit or loss and past performance does not ensure future results. Asset allocation and diversification do not ensure or guarantee better performance and cannot eliminate the risk of investment losses. Charts and graphs presented do not represent the performance of KCP or any of its advisory clients. Historical performance results for investment indexes and/or categories, generally do not reflect the deduction of transaction and/or custodial charges or the deduction of an investment management fee, the incurrence of which would have the effect of decreasing historical performance results. There can be no assurances that a client’s portfolio will match or outperform any particular benchmark. KCP makes no warranties with regard to the information or results obtained by its use and disclaims any liability arising out of your use of, or reliance on, the information. The information is subject to change and, although based on information that KCP considers reliable, it is not guaranteed as to accuracy or completeness. This information may become outdated and KCP is not obligated to update any information or opinions contained herein. Articles herein may not necessarily reflect the investment position or the strategies of KCP. KCP is registered as an investment adviser and only transacts business in states where it is properly registered or is excluded or exempted from registration requirements. Registration as an investment adviser does not constitute an endorsement of the firm by securities regulators nor does it indicate that the adviser has attained a particular level of skill or ability.